Adidas 1999 Annual Report Download - page 10
Download and view the complete annual report
Please find page 10 of the 1999 Adidas annual report below. You can navigate through the pages in the report by either clicking on the pages listed below, or by using the keyword search tool below to find specific information within the annual report.-
 1
1 -
 2
2 -
 3
3 -
 4
4 -
 5
5 -
 6
6 -
 7
7 -
 8
8 -
 9
9 -
 10
10 -
 11
11 -
 12
12 -
 13
13 -
 14
14 -
 15
15 -
 16
16 -
 17
17 -
 18
18 -
 19
19 -
 20
20 -
 21
21 -
22
-
23
-
24
-
25
-
26
-
27
-
28
-
29
-
30
-
31
-
32
-
33
-
34
-
35
-
36
-
37
-
38
-
39
-
40
-
41
-
42
-
43
-
44
-
45
-
46
-
47
-
48
-
49
-
50
-
51
-
52
-
53
-
54
-
55
-
56
-
57
-
58
-
59
-
60
-
61
-
62
-
63
-
64
-
65
-
66
-
67
-
68
-
69
-
70
-
71
-
72
-
73
-
74
-
75
-
76
-
77
-
78
-
79
-
80
-
81
-
82
-
83
-
84
-
85
-
86
-
87
-
88
-
89
-
90
-
91
-
92
-
93
-
94
 |
 |

6
Management Discussion and Analysis
The contribution of the Footwear division to total net
sales of the Group increased by 1.1 percentage points
to 41.5%. This means Footwear is now again the largest
product division within the adidas-Salomon Group.
Decline in Apparel sales
Apparel sales, in contrast, were impacted by changing
consumer preferences. Total Apparel sales reached DM
4.3 billion, which represents a decrease of 0.5% com-
pared to 1998. Apparel contributed 40.9% of total net
sales of the Group in 1999, down 2.6 percentage points
on the previous year.
Increase in Hardware sales
As the products of the Salomon and Taylor Made brands
are primarily included in the Hardware division, which
has changed slightly compared to the prior year, and as
both brands also recorded strong sales growth, this divi-
sion showed a correspondingly strong increase, growing
by 15.1% to DM 1.8 billion.
Strongest sales growth in Asia
In terms of regional performance, Asia delivered the high-
est growth rates. The increase of 70.3% to DM 1.3 billion
was driven primarily, although not exclusively, by the
first-time inclusion of the sales of adidas Japan. Even
excluding adidas Japan, net sales in Region Asia grew
by 15.6%. This development is an indication that most
of the countries throughout Asia have largely recovered
from the effects of the economic and currency crises.
adidas-Salomon was also able to achieve significant
growth in sales in Latin America. Net sales in this region
totaled DM 246 million, which is an increase of 12.5%.
North America achieved only modest sales growth of
1.9% in 1999, after having delivered the highest growth
rate the previous year. Product sales under the adidas
brand name were very strong in the first half of the year
but declined in the second half to record an overall de-
crease of 1% for the year. In a difficult overall market
for
athletic footwear and particularly for sports apparel,
the adidas brand managed to maintain its overall market
share.
Sales performance of the Taylor Made and Salomon
brands in North America was strong. Taylor Made re-
corded an 11% increase in sales, proving that, in golf in
particular, innovative products sell well even in a flat
market. Salomon increased sales by 21%, becoming the
Group’s fastest growing brand in the American market.
Growth in Asia, North America and Latin America was
sufficient to more than offset a slight decline in sales in
Europe. Despite an upward trend over the course of the
year, sales under the adidas brand name in Europe ex-
perienced a year-over-year decline of just under 4%.
Strong growth in France and the Benelux countries was
not able to offset decreases in the U.K., Germany and
Spain. The picture in the first half of the year was very
different from the second half. In contrast to North
America though, Region Europe showed a clear upward
trend, and in the fourth quarter even recorded signifi-
cant sales growth.
The Salomon and Taylor Made brands performed very
solidly in Europe. Taylor Made profited from a positive
overall market development, increasing sales by 11%.
Salomon achieved excellent growth rates with both sum-
mer and winter products, recording an 18% increase in
sales for the full year.
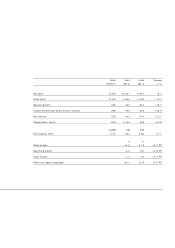
Difference to 100% due to HQ/Consolidation
Share of Change
net sales year-over-
in % year in %
Footwear 41.5 +8.5
Apparel 40.9 –0.5
Hardware 17.4 +15.3
NET SALES BY DIVISION
Americas Europe Asia
36.3% 50.9% 12.2%
NET SALES BY REGION
Difference to 100% due to HQ/Consolidation