eBay 2001 Annual Report Download - page 22
Download and view the complete annual report
Please find page 22 of the 2001 eBay annual report below. You can navigate through the pages in the report by either clicking on the pages listed below, or by using the keyword search tool below to find specific information within the annual report.-
 1
1 -
2
-
3
-
4
-
5
-
6
-
7
-
8
-
9
-
10
-
11
-
 12
12 -
 13
13 -
 14
14 -
 15
15 -
 16
16 -
 17
17 -
 18
18 -
 19
19 -
 20
20 -
 21
21 -
 22
22 -
 23
23 -
 24
24 -
 25
25 -
 26
26 -
 27
27 -
 28
28 -
 29
29 -
 30
30 -
 31
31 -
 32
32 -
33
-
34
-
35
-
36
-
37
-
38
-
39
-
40
-
41
-
42
-
43
-
44
-
45
-
46
-
47
-
48
-
49
-
50
-
51
-
52
-
53
-
54
-
55
-
56
-
57
-
58
-
59
-
60
-
61
-
62
-
63
-
64
-
65
-
66
-
67
-
68
-
69
-
70
-
71
-
72
-
73
-
74
-
75
-
76
-
77
-
78
-
79
-
80
-
81
-
82
-
83
-
84
-
85
-
86
-
87
-
88
-
89
-
90
-
91
-
92
-
93
-
94
-
95
-
96
-
97
-
98
-
99
-
100
-
101
 |
 |

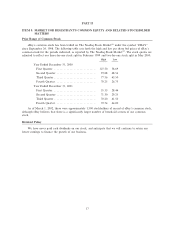
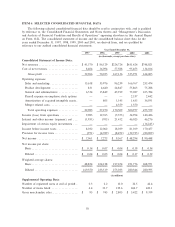
ITEM 6: SELECTED CONSOLIDATED FINANCIAL DATA
The following selected consolidated Ñnancial data should be read in conjunction with, and is qualiÑed
by reference to, the Consolidated Financial Statements and Notes thereto and ""Management's Discussion
and Analysis of Financial Condition and Results of Operations'' appearing elsewhere in this Annual Report
on Form 10-K. The consolidated statement of income and the consolidated balance sheet data for the
years ended December 31, 1997, 1998, 1999, 2000 and 2001, are derived from, and are qualiÑed by
reference to our audited consolidated Ñnancial statements.
Year Ended December 31,
1997 1998 1999 2000 2001
(in thousands, except per share data)
Consolidated Statement of Income Data:
Net revenues ÏÏÏÏÏÏÏÏÏÏÏÏÏÏÏÏÏÏÏÏÏÏÏÏÏÏÏÏ $ 41,370 $ 86,129 $224,724 $431,424 $748,821
Cost of net revenues ÏÏÏÏÏÏÏÏÏÏÏÏÏÏÏÏÏÏÏÏÏÏ 8,404 16,094 57,588 95,453 134,816
Gross proÑt ÏÏÏÏÏÏÏÏÏÏÏÏÏÏÏÏÏÏÏÏÏÏÏÏÏ 32,966 70,035 167,136 335,971 614,005
Operating expenses:
Sales and marketing ÏÏÏÏÏÏÏÏÏÏÏÏÏÏÏÏÏÏÏÏ 15,618 35,976 96,239 166,767 253,474
Product development ÏÏÏÏÏÏÏÏÏÏÏÏÏÏÏÏÏÏÏ 831 4,640 24,847 55,863 75,288
General and administrative ÏÏÏÏÏÏÏÏÏÏÏÏÏÏ 6,534 15,849 43,919 73,027 105,784
Payroll expense on employee stock options Ì Ì Ì 2,337 2,442
Amortization of acquired intangible assetsÏÏ Ì 805 1,145 1,433 36,591
Merger related costs ÏÏÏÏÏÏÏÏÏÏÏÏÏÏÏÏÏÏÏÏ Ì Ì 4,359 1,550 Ì
Total operating expenses ÏÏÏÏÏÏÏÏÏÏÏÏÏÏ 22,983 57,270 170,509 300,977 473,579
Income (loss) from operations ÏÏÏÏÏÏÏÏÏÏÏÏÏ 9,983 12,765 (3,373) 34,994 140,426
Interest and other income (expense), net ÏÏÏÏ (1,951) (703) 21,412 46,025 46,276
Impairment of certain equity investments ÏÏÏÏ ÌÌÌÌ(16,245)
Income before income taxes ÏÏÏÏÏÏÏÏÏÏÏÏÏÏÏ 8,032 12,062 18,039 81,019 170,457
Provision for income taxes ÏÏÏÏÏÏÏÏÏÏÏÏÏÏÏÏÏ (971) (4,789) (8,472) (32,725) (80,009)
Net income ÏÏÏÏÏÏÏÏÏÏÏÏÏÏÏÏÏÏÏÏÏÏÏÏÏÏÏÏÏ $ 7,061 $ 7,273 $ 9,567 $ 48,294 $ 90,448
Net income per share:
BasicÏÏÏÏÏÏÏÏÏÏÏÏÏÏÏÏÏÏÏÏÏÏÏÏÏÏÏÏÏÏÏÏÏ $ 0.14 $ 0.07 $ 0.04 $ 0.19 $ 0.34
Diluted ÏÏÏÏÏÏÏÏÏÏÏÏÏÏÏÏÏÏÏÏÏÏÏÏÏÏÏÏÏÏÏ $ 0.04 $ 0.03 $ 0.04 $ 0.17 $ 0.32
Weighted average shares:
BasicÏÏÏÏÏÏÏÏÏÏÏÏÏÏÏÏÏÏÏÏÏÏÏÏÏÏÏÏÏÏÏÏÏ 48,854 104,128 217,674 251,776 268,971
Diluted ÏÏÏÏÏÏÏÏÏÏÏÏÏÏÏÏÏÏÏÏÏÏÏÏÏÏÏÏÏÏÏ 169,550 233,519 273,033 280,346 280,595
(in millions)
Supplemental Operating Data:
Number of registered users at end of period ÏÏ 0.3 2.2 10.0 22.5 42.4
Number of items listed ÏÏÏÏÏÏÏÏÏÏÏÏÏÏÏÏÏÏÏ 4.4 33.7 129.6 264.7 423.1
Gross merchandise salesÏÏÏÏÏÏÏÏÏÏÏÏÏÏÏÏÏÏÏ $ 95 $ 745 $ 2,805 $ 5,422 $ 9,319
18