eBay 2000 Annual Report Download - page 30
Download and view the complete annual report
Please find page 30 of the 2000 eBay annual report below. You can navigate through the pages in the report by either clicking on the pages listed below, or by using the keyword search tool below to find specific information within the annual report.-
 1
1 -
2
-
3
-
4
-
5
-
6
-
7
-
8
-
9
-
10
-
11
-
12
-
13
-
14
-
15
-
16
-
17
-
18
-
19
-
 20
20 -
 21
21 -
 22
22 -
 23
23 -
 24
24 -
 25
25 -
 26
26 -
 27
27 -
 28
28 -
 29
29 -
 30
30 -
 31
31 -
 32
32 -
 33
33 -
 34
34 -
 35
35 -
 36
36 -
 37
37 -
 38
38 -
 39
39 -
 40
40 -
41
-
42
-
43
-
44
-
45
-
46
-
47
-
48
-
49
-
50
-
51
-
52
-
53
-
54
-
55
-
56
-
57
-
58
-
59
-
60
-
61
-
62
-
63
-
64
-
65
-
66
-
67
-
68
-
69
-
70
-
71
-
72
-
73
-
74
-
75
-
76
-
77
-
78
-
79
-
80
-
81
-
82
-
83
-
84
-
85
-
86
-
87
-
88
-
89
-
90
-
91
-
92
 |
 |

launched in April 1998. Internet Auction is listed on the KOSDAQ and is expected to continue to trade on
KOSDAQ.
We acquired 6,274,795 of the outstanding shares of Internet Auction, slightly more than 50%, at a Ñxed
price of 24,000 Korean won per share or approximately $120 million in the aggregate. The transaction will be
accounted for using the purchase method of accounting and accordingly, the purchase price will be allocated
to the tangible and intangible assets acquired and the liabilities assumed on the basis of their respective fair
values on the acquisition date.
iBazar S.A.
On February 21, 2001, we signed a binding agreement to acquire iBazar S.A. (iBazar). iBazar is based in
Paris and introduced online, person-to-person trading in France when it launched in October 1998. Currently,
iBazar has websites in Belgium, Brazil, France, Italy, the Netherlands, Portugal, Spain, and Sweden.
As consideration for 100% of the outstanding shares of iBazar, we will issue approximately 2,250,000
shares of our common stock, subject to a minimum valuation of approximately $66 million and a maximum
valuation of approximately $112 million, based on the value of our stock at closing. The acquisition will be
accounted for as a purchase business combination and is subject to various regulatory approvals.
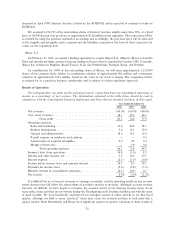
Results of Operations
The following table sets forth, for the periods presented, certain data from our consolidated statements of
income as a percentage of net revenues. The information contained in the table below should be read in
conjunction with the Consolidated Financial Statements and Notes thereto included elsewhere in this report.
Year Ended December 31,
1998 1999 2000
Net revenues ÏÏÏÏÏÏÏÏÏÏÏÏÏÏÏÏÏÏÏÏÏÏÏÏÏÏÏÏÏÏÏÏÏÏÏÏÏÏÏÏÏÏÏÏÏÏÏÏ 100.0% 100.0% 100.0%
Cost of net revenues ÏÏÏÏÏÏÏÏÏÏÏÏÏÏÏÏÏÏÏÏÏÏÏÏÏÏÏÏÏÏÏÏÏÏÏÏÏÏÏÏÏÏ 18.7 25.6 22.1
Gross proÑt ÏÏÏÏÏÏÏÏÏÏÏÏÏÏÏÏÏÏÏÏÏÏÏÏÏÏÏÏÏÏÏÏÏÏÏÏÏÏÏÏÏ 81.3 74.4 77.9
Operating expenses:
Sales and marketing ÏÏÏÏÏÏÏÏÏÏÏÏÏÏÏÏÏÏÏÏÏÏÏÏÏÏÏÏÏÏÏÏÏÏÏÏÏÏÏÏ 41.8 42.8 38.7
Product development ÏÏÏÏÏÏÏÏÏÏÏÏÏÏÏÏÏÏÏÏÏÏÏÏÏÏÏÏÏÏÏÏÏÏÏÏÏÏÏ 5.4 11.1 12.9
General and administrative ÏÏÏÏÏÏÏÏÏÏÏÏÏÏÏÏÏÏÏÏÏÏÏÏÏÏÏÏÏÏÏÏÏÏ 18.4 19.5 16.9
Payroll expense on employee stock options ÏÏÏÏÏÏÏÏÏÏÏÏÏÏÏÏÏÏÏÏÏ Ì Ì 0.5
Amortization of acquired intangibles ÏÏÏÏÏÏÏÏÏÏÏÏÏÏÏÏÏÏÏÏÏÏÏÏÏÏ 0.9 0.5 0.3
Merger related costs ÏÏÏÏÏÏÏÏÏÏÏÏÏÏÏÏÏÏÏÏÏÏÏÏÏÏÏÏÏÏÏÏÏÏÏÏÏÏÏÏ Ì 1.9 0.4
Total operating expenses ÏÏÏÏÏÏÏÏÏÏÏÏÏÏÏÏÏÏÏÏÏÏÏÏÏÏÏÏÏÏ 66.5 75.8 69.7
Income/(loss) from operations ÏÏÏÏÏÏÏÏÏÏÏÏÏÏÏÏÏÏÏÏÏÏÏÏÏÏÏÏÏÏÏÏÏ 14.8 (1.4) 8.2
Interest and other income, net ÏÏÏÏÏÏÏÏÏÏÏÏÏÏÏÏÏÏÏÏÏÏÏÏÏÏÏÏÏÏÏÏÏ 2.2 10.6 10.7
Interest expenseÏÏÏÏÏÏÏÏÏÏÏÏÏÏÏÏÏÏÏÏÏÏÏÏÏÏÏÏÏÏÏÏÏÏÏÏÏÏÏÏÏÏÏÏÏÏ (2.5) (1.0) (0.8)
Income before income taxes and minority interest ÏÏÏÏÏÏÏÏÏÏÏÏÏÏÏÏÏ 14.5 8.2 18.1
Provision for income taxes ÏÏÏÏÏÏÏÏÏÏÏÏÏÏÏÏÏÏÏÏÏÏÏÏÏÏÏÏÏÏÏÏÏÏÏÏÏ (5.6) (3.8) (7.6)
Minority interest in consolidated companies ÏÏÏÏÏÏÏÏÏÏÏÏÏÏÏÏÏÏÏÏÏÏ (0.5) (0.1) 0.7
Net income ÏÏÏÏÏÏÏÏÏÏÏÏÏÏÏÏÏÏÏÏÏÏÏÏÏÏÏÏÏÏÏÏÏÏÏÏÏÏÏÏÏÏÏÏÏÏÏÏÏ 8.4% 4.3% 11.2%
It is diÇcult for us to forecast revenues or earnings accurately, and the operating results in one or more
future quarters may fall below the expectations of securities analysts or investors. Although accurate revenue
forecasts are diÇcult, we have begun to recognize the seasonal nature of our business because many of our
users reduce their activities on our website during the Thanksgiving and Christmas holidays and with the onset
of good weather. We have historically experienced our strongest quarter of online growth in our Ñrst Ñscal
quarter, although our shift to more ""practical'' items may cause our seasonal patterns to look more like a
typical retailer. Both ButterÑelds and Kruse have signiÑcant quarter-to-quarter variations in their results of
25