eBay 1999 Annual Report Download - page 24
Download and view the complete annual report
Please find page 24 of the 1999 eBay annual report below. You can navigate through the pages in the report by either clicking on the pages listed below, or by using the keyword search tool below to find specific information within the annual report.-
 1
1 -
2
-
3
-
4
-
5
-
6
-
7
-
8
-
9
-
10
-
11
-
12
-
13
-
 14
14 -
 15
15 -
 16
16 -
 17
17 -
 18
18 -
 19
19 -
 20
20 -
 21
21 -
 22
22 -
 23
23 -
 24
24 -
 25
25 -
 26
26 -
 27
27 -
 28
28 -
 29
29 -
 30
30 -
 31
31 -
 32
32 -
 33
33 -
 34
34 -
35
-
36
-
37
-
38
-
39
-
40
-
41
-
42
-
43
-
44
-
45
-
46
-
47
-
48
-
49
-
50
-
51
-
52
-
53
-
54
-
55
-
56
-
57
-
58
-
59
-
60
-
61
-
62
-
63
-
64
-
65
-
66
-
67
-
68
-
69
-
70
-
71
-
72
-
73
-
74
-
75
-
76
-
77
-
78
-
79
-
80
-
81
 |
 |

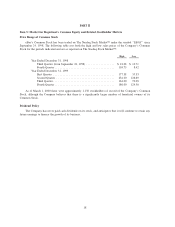
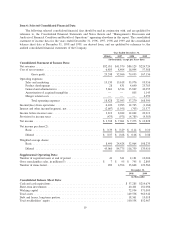
Item 6: Selected Consolidated Financial Data
The following selected consolidated financial data should be read in conjunction with, and are qualified by
reference to, the Consolidated Financial Statements and Notes thereto and ‘‘Management’s Discussion and
Analysis of Financial Condition and Results of Operations’’ appearing elsewhere in this report. The consolidated
statement of income data for the years ended December 31, 1996, 1997, 1998 and 1999 and the consolidated
balance sheet data at December 31, 1998 and 1999, are derived from, and are qualified by reference to, the
audited consolidated financial statements of the Company.
Year Ended December 31,
1996(1) 1997 1998 1999
(in thousands, except per share data)
Consolidated Statement of Income Data:
Net revenues ......................................... $32,051 $41,370 $86,129 $224,724
Cost of net revenues ................................... 6,803 8,404 16,094 57,588
Gross profit ................................... 25,248 32,966 70,035 167,136
Operating expenses:
Sales and marketing ................................ 13,139 15,618 35,976 95,956
Product development ............................... 28 831 4,640 23,785
General and administrative ........................... 5,661 6,534 15,849 43,055
Amortization of acquired intangibles .................... — — 805 1,145
Merger related costs ................................ — — — 4,359
Total operating expenses ......................... 18,828 22,983 57,270 168,300
Income/(loss) from operations ............................ 6,420 9,983 12,765 (1,164)
Interest and other income/(expense), net ..................... (2,607) (1,951) (703) 21,377
Income before income taxes .............................. 3,813 8,032 12,062 20,213
Provision for income taxes ............................... (475) (971) (4,789) (9,385)
Net income .......................................... $ 3,338 $ 7,061 $ 7,273 $ 10,828
Net income per share(2):
Basic ........................................... $ 0.39 $ 0.29 $ 0.14 $ 0.10
Diluted ......................................... $ 0.07 $ 0.08 $ 0.06 $ 0.08
Weighted average shares:
Basic ........................................... 8,490 24,428 52,064 108,235
Diluted ......................................... 45,060 84,775 116,759 135,910
Supplemental Operating Data:
Number of registered users at end of period .................. 41 341 2,181 10,006
Gross merchandise sales, in millions(3) ..................... $ 7 $ 95 $ 745 $ 2,805
Number of items listed .................................. 289 4,394 33,668 129,560
December 31,
1998 1999
(in thousands)
Consolidated Balance Sheet Data:
Cash and cash equivalents .............................................. $ 37,285 $219,679
Short-term investments ................................................ 40,401 181,086
Working capital ..................................................... 72,934 371,009
Total assets ......................................................... 149,536 963,942
Debt and leases, long-term portion ........................................ 18,361 15,018
Total stockholders’ equity .............................................. 100,538 852,467
19