XM Radio 1999 Annual Report Download - page 29
Download and view the complete annual report
Please find page 29 of the 1999 XM Radio annual report below. You can navigate through the pages in the report by either clicking on the pages listed below, or by using the keyword search tool below to find specific information within the annual report.-
 1
1 -
2
-
3
-
4
-
5
-
6
-
7
-
8
-
9
-
10
-
11
-
12
-
13
-
14
-
15
-
16
-
17
-
18
-
 19
19 -
 20
20 -
 21
21 -
 22
22 -
 23
23 -
 24
24 -
 25
25 -
 26
26 -
 27
27 -
 28
28 -
 29
29 -
 30
30 -
 31
31 -
 32
32 -
 33
33 -
 34
34 -
 35
35 -
 36
36 -
 37
37 -
 38
38 -
 39
39 -
40
-
41
-
42
-
43
-
44
-
45
-
46
-
47
-
48
-
49
-
50
-
51
-
52
-
53
-
54
-
55
-
56
 |
 |

27 1999 ANNUAL REPORT
To date, we have not identified any system which demonstrates symptoms of not being Year 2000 Ready or for
which a suitable alternative cannot be implemented.
Quantitative and Qualitative Disclosures About Market Risk
As of December 31, 1999, we do not have any derivitave financial instruments and do not intend to use
derivatives. We invest our cash in short-term commercial paper and investment-grade corporate and government
obligations and money market funds. All of our indebtedness was automatically converted into equity upon
completion of our initial public offering. As a result, we believe that our exposure to interest rate risk is not
material to our results of operations.
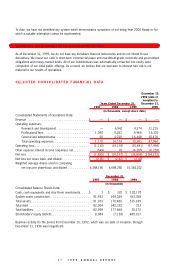
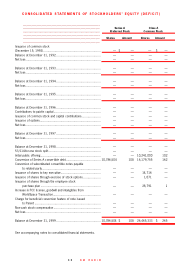
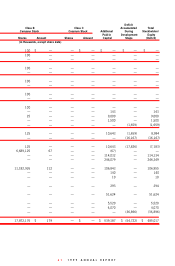
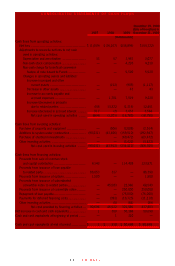
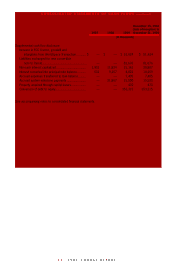
SELECTED CONSOLiDATED FiNANCiAL DATA
December 15,
1992 (date of
inception) to
Years Ended December 31, December 31,
1997 1998 1999 1999
(in thousands, except share data)
Consolidated Statements of Operations Data:
Revenue . . . . . . . . . . . . . . . . . . . . . . . . . . . . . . . . . .$ — $ — $ — $ —
Operating expenses:
Research and development. . . . . . . . . . . . . . . . . . — 6,941 4,274 11,215
Professional fees . . . . . . . . . . . . . . . . . . . . . . . . . 1,090 5,242 9,969 16,301
General and administrative . . . . . . . . . . . . . . . . . . 20 4,010 16,448 20,478
Total operating expenses . . . . . . . . . . . . . . . . . . . 1,110 16,193 30,691 47,994
Operating loss . . . . . . . . . . . . . . . . . . . . . . . . . . . . . . (1,110) (16,193) (30,691) (47,994)
Other expense interest income (expense), net... . . . . . . . (549) 26 (6,205) (6,728)
Net loss . . . . . . . . . . . . . . . . . . . . . . . . . . . . . . . . . .$ (1,659) $ (16,167) $ (36,896) $ (54,722)
Net loss per share basic and diluted . . . . . . . . . . . . . . .$ (0.26) $ (2.42) $ (2.40)
Weighted average shares used in computing
net loss per share-basic and diluted . . . . . . . . . . . . 6,368,166 6,689,250 15,344,102
December 31,
1997 1998 1999
(in thousands)
Consolidated Balance Sheets Data:
Cash, cash equivalents and short-term investments. . . . .$ 1 $ 310 $ 120,170
System under construction. . . . . . . . . . . . . . . . . . . . . . 91,932 169,029 362,358
Total assets . . . . . . . . . . . . . . . . . . . . . . . . . . . . . . . . 91,933 170,485 515,189
Total debt . . . . . . . . . . . . . . . . . . . . . . . . . . . . . . . . . 82,504 140,332 212
Total liabilities. . . . . . . . . . . . . . . . . . . . . . . . . . . . . . . 82,949 177,668 30,172
Stockholders’ equity (deficit). . . . . . . . . . . . . . . . . . . . . 8,984 (7,183) 485,017
Business activity for the period from December 15, 1992, which was our date of inception, through
December 31, 1996 was insignificant.