Vodafone 1997 Annual Report Download - page 31
Download and view the complete annual report
Please find page 31 of the 1997 Vodafone annual report below. You can navigate through the pages in the report by either clicking on the pages listed below, or by using the keyword search tool below to find specific information within the annual report.-
 1
1 -
2
-
3
-
4
-
5
-
6
-
7
-
8
-
9
-
10
-
11
-
12
-
13
-
14
-
15
-
16
-
17
-
18
-
19
-
20
-
 21
21 -
 22
22 -
 23
23 -
 24
24 -
 25
25 -
 26
26 -
 27
27 -
 28
28 -
 29
29 -
 30
30 -
 31
31 -
 32
32 -
 33
33 -
 34
34 -
 35
35 -
 36
36 -
 37
37 -
 38
38 -
 39
39 -
 40
40 -
 41
41 -
42
-
43
-
44
-
45
-
46
-
47
-
48
-
49
-
50
-
51
-
52
-
53
-
54
-
55
-
56
-
57
-
58
-
59
-
60
-
61
-
62
-
63
-
64
-
65
-
66
-
67
-
68
-
69
-
70
-
71
 |
 |

Vodafone Group Plc Annual Report & Accounts for the year ended 31 March 1997
1 2 3 4 5 6 7 8 9 10 11 12 13 14 15 16 17 18 19 20 21 22 23 24 25 26 27 28
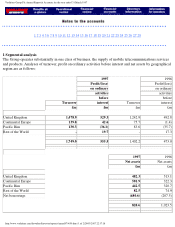
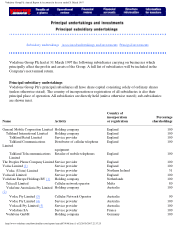
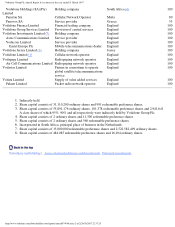
1 Segmental analysis
The Group operates substantially in one class of business, the supply of mobile telecommunications services
and products. Analyses of turnover, profit on ordinary activities before interest and net assets by geographical
region are as follows:
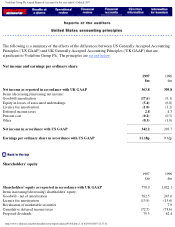
1997 1996
Profit/(loss) Profit/(loss)
on ordinary on ordinary
activities activities
before before
Turnover interest Turnover interest
£m £m £m £m
United Kingdom 1,478.9 529.3 1,242.9 492.8
Continental Europe 139.8 42.6 75.7 (1.4)
Pacific Rim 130.3 (36.1) 83.6 (35.7)
Rest of the World - 19.7 - 17.3
1,749.0 555.5 1,402.2 473.0
1997 1996
Net assets Net assets
£m £m
United Kingdom 482.3 513.1
Continental Europe 501.9 322.3
Pacific Rim 442.5 320.7
Rest of the World 82.5 74.9
Net borrowings (680.6) (207.5)
828.6 1,023.5
http://www.vodafone.com/download/investor/reports/annual97/4/50.htm (1 of 2)29/03/2007 22:37:18