United Healthcare 2002 Annual Report Download - page 44
Download and view the complete annual report
Please find page 44 of the 2002 United Healthcare annual report below. You can navigate through the pages in the report by either clicking on the pages listed below, or by using the keyword search tool below to find specific information within the annual report.-
 1
1 -
2
-
3
-
4
-
5
-
6
-
7
-
8
-
9
-
10
-
11
-
12
-
13
-
14
-
15
-
16
-
17
-
18
-
19
-
20
-
21
-
22
-
23
-
24
-
25
-
26
-
27
-
28
-
29
-
30
-
31
-
32
-
33
-
 34
34 -
 35
35 -
 36
36 -
 37
37 -
 38
38 -
 39
39 -
 40
40 -
 41
41 -
 42
42 -
 43
43 -
 44
44 -
 45
45 -
 46
46 -
 47
47 -
 48
48 -
 49
49 -
 50
50 -
 51
51 -
 52
52 -
 53
53 -
 54
54 -
55
-
56
-
57
-
58
-
59
-
60
-
61
-
62
-
63
-
64
-
65
-
66
-
67
 |
 |

{ 43 }
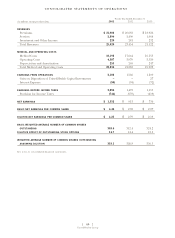
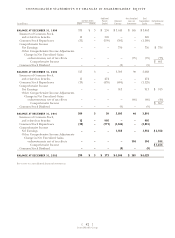
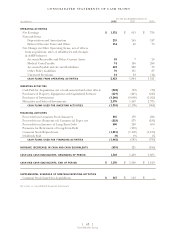
UnitedHealth Group
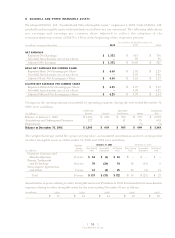
CONSOLIDATED STATEMENTS OF CASH FLOWS
For the Year Ended December 31,
(in millions) 2002 2001 2000
OPERATING ACTIVITIES
Net Earnings $ 1,352 $913 $736
Noncash Items
Depreciation and Amortization 255 265 247
Deferred Income Taxes and Other 154 40 73
Net Change in Other Operating Items, net of effects
from acquisitions, sales of subsidiaries and changes
in AARP balances
Accounts Receivable and Other Current Assets 83 7 26
Medical Costs Payable 74 156 288
Accounts Payable and Accrued Liabilities 423 280 75
Other Policy Liabilities 70 131 87
Unearned Premiums 12 52 (11)
CASH FLOWS FROM OPERATING ACTIVITIES
2,423 1,844 1,521
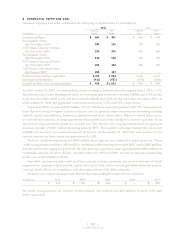
INVESTING ACTIVITIES
Cash Paid for Acquisitions, net of cash assumed and other effects (302) (92) (76)
Purchases of Property, Equipment and Capitalized Software (419) (425) (245)
Purchases of Investments (3,246) (2,088) (3,022)
Maturities and Sales of Investments 2,576 1,467 2,375
CASH FLOWS USED FOR INVESTING ACTIVITIES
(1,391) (1,138) (968)
FINANCING ACTIVITIES
Proceeds from Common Stock Issuances 205 178 228
Proceeds from (Payments of) Commercial Paper, net (223) 275 (182)
Proceeds from Issuance of Long-Term Debt 400 250 400
Payments for Retirement of Long-Term Debt –(150) –
Common Stock Repurchases (1,815) (1,129) (1,180)
Dividends Paid (9) (9) (5)
CASH FLOWS USED FOR FINANCING ACTIVITIES
(1,442) (585) (739)
INCREASE (DECREASE) IN CASH AND CASH EQUIVALENTS
(410) 121 (186)
CASH AND CASH EQUIVALENTS, BEGINNING OF PERIOD
1,540 1,419 1,605
CASH AND CASH EQUIVALENTS, END OF PERIOD
$ 1,130 $1,540 $1,419
SUPPLEMENTAL SCHEDULE OF NONCASH INVESTING ACTIVITIES
Common Stock Issued for Acquisitions $ 567 $163 $–
See notes to consolidated financial statements.