United Healthcare 2002 Annual Report Download - page 28
Download and view the complete annual report
Please find page 28 of the 2002 United Healthcare annual report below. You can navigate through the pages in the report by either clicking on the pages listed below, or by using the keyword search tool below to find specific information within the annual report.-
 1
1 -
2
-
3
-
4
-
5
-
6
-
7
-
8
-
9
-
10
-
11
-
12
-
13
-
14
-
15
-
16
-
17
-
 18
18 -
 19
19 -
 20
20 -
 21
21 -
 22
22 -
 23
23 -
 24
24 -
 25
25 -
 26
26 -
 27
27 -
 28
28 -
 29
29 -
 30
30 -
 31
31 -
 32
32 -
 33
33 -
 34
34 -
 35
35 -
 36
36 -
 37
37 -
 38
38 -
39
-
40
-
41
-
42
-
43
-
44
-
45
-
46
-
47
-
48
-
49
-
50
-
51
-
52
-
53
-
54
-
55
-
56
-
57
-
58
-
59
-
60
-
61
-
62
-
63
-
64
-
65
-
66
-
67
 |
 |

{ 27 }
UnitedHealth Group
2001 RESULTS COMPARED TO 2000 RESULTS
CONSOLIDATED FINANCIAL RESULTS
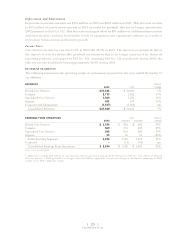
Revenues
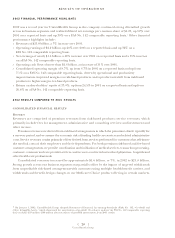
Consolidated revenues increased by 11% in 2001 to $23.5 billion. Strong and balanced growth across all
business segments was partially offset by the impact of planned exits in 2000 from UnitedHealthcare’s
commercial businesses in the Pacific Coast region, the withdrawal of its Medicare+Choice product
offering from targeted counties and the closure of Uniprise’s Medicare fiscal intermediary operations.
Following is a discussion of 2001 consolidated revenue trends for each revenue component.
Premium Revenues Consolidated premium revenues in 2001 totaled $20.7 billion, an increase of $1.8 billion,
or 9%, compared with 2000. This increase was primarily driven by average net premium rate increases in
excess of 13% on UnitedHealthcare’s renewing commercial risk-based business, partially offset by the impact
of business and market exits.
Service Revenues Service revenues in 2001 totaled $2.5 billion, an increase of $526 million, or 27%, over
2000. The overall increase in service revenues was primarily the result of 20% growth in Uniprise’s customer
base, growth in UnitedHealthcare’s fee-based business, and establishment of the Ovations Pharmacy
Services business in June 2001.
Investment and Other Income Investment and other income in 2001 totaled $281 million, an increase
of $49 million over 2000. Lower interest yields on investments in 2001 compared with 2000 were substantially
offset by the impact of increased levels of cash and fixed-income investments in 2001. Net realized capital
gains in 2001 were $11 million, compared to net realized capital losses of $34 million in 2000.
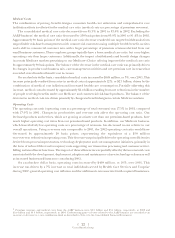
Medical Costs
The consolidated medical care ratio decreased from 85.4% in 2000 to 85.3% in 2001. Excluding the
AARP business, the medical care ratio was 83.9% in both 2000 and 2001, as net premium rate increases
were generally well matched with increases in medical benefit costs.
On an absolute dollar basis, medical costs increased $1.5 billion, or 9%, over 2000. The increase was
driven by medical cost inflation, increased health care consumption patterns, benefit changes and
product mix changes.