United Healthcare 2001 Annual Report Download - page 32
Download and view the complete annual report
Please find page 32 of the 2001 United Healthcare annual report below. You can navigate through the pages in the report by either clicking on the pages listed below, or by using the keyword search tool below to find specific information within the annual report.-
 1
1 -
2
-
3
-
4
-
5
-
6
-
7
-
8
-
9
-
10
-
11
-
12
-
13
-
14
-
15
-
16
-
17
-
18
-
19
-
20
-
21
-
 22
22 -
 23
23 -
 24
24 -
 25
25 -
 26
26 -
 27
27 -
 28
28 -
 29
29 -
 30
30 -
 31
31 -
 32
32 -
 33
33 -
 34
34 -
 35
35 -
 36
36 -
 37
37 -
 38
38 -
 39
39 -
 40
40 -
 41
41 -
 42
42 -
43
-
44
-
45
-
46
-
47
-
48
-
49
-
50
-
51
-
52
-
53
-
54
-
55
-
56
-
57
-
58
-
59
-
60
-
61
-
62
 |
 |

UnitedHealth Group
PAGE 31
Our non-regulated businesses also generate cash from operations. Additionally, we issue long-term
debt and commercial paper with staggered maturity dates and have available credit facilities. These
additional sources of liquidity allow us to maintain further operating and financial flexibility. Because of
this flexibility, we typically maintain low cash and investment balances in our non-regulated companies.
Cash in these entities is generally used to reinvest in our businesses in the form of capital expenditures,
to expand the depth and breadth of our services through business acquisitions, and to repurchase
shares of our common stock.
Cash generated from operating activities, our primary source of liquidity, is principally attributable to
net earnings, excluding depreciation and amortization. As such, any future decline in our profitability
would likely have a negative impact on our liquidity. The availability of financing, in the form of debt or
equity, is influenced by many factors including our profitability, operating cash flows, debt levels, debt
ratings, contractual restrictions, regulatory requirements and market conditions. We believe that our
strategies and actions toward maintaining financial flexibility mitigate much of this risk.
CASH AND INVESTMENTS
During 2001, we generated cash from operations of more than $1.8 billion, an increase of $323 million, or
21%, over 2000. The increase in operating cash flows primarily resulted from an increase of $195 million
in net income excluding depreciation and amortization expense and working capital improvements of
approximately $111 million.
We maintained a strong financial condition and liquidity position, with cash and investments of
$5.7 billion at December 31, 2001. Total cash and investments increased by $645 million since December 31,
2000, primarily resulting from strong cash flows from operations partially offset by common stock repurchases.
As further described under “Regulatory Capital and Dividend Restrictions,” many of our subsidiaries
are subject to various government regulations that restrict the timing and amount of dividends and
other distributions that may be paid to their parent companies. At December 31, 2001, approximately
$660 million of our $5.7 billion of cash and investments was held by non-regulated subsidiaries. Of this
amount, approximately $260 million was segregated for future regulatory capital needs and $230 million
was available for general corporate use, including acquisitions and share repurchases. The remaining
$170 million consists primarily of public and non-public equity securities held by UnitedHealth Capital,
our investment capital business.
FINANCING AND INVESTING ACTIVITIES
We use commercial paper and debt to maintain adequate operating and financial flexibility. As of
December 31, 2001 and 2000, we had commercial paper and debt outstanding of $1.6 billion and
$1.2 billion, respectively. Proceeds from the net increase of $375 million in total commercial paper
and debt will be used for general corporate purposes, which may include working capital, business
acquisitions, capital expenditures and share repurchases.
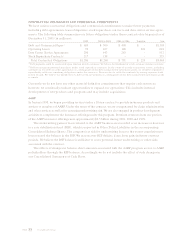
Our debt-to-total-capital ratio was 28.9% and 24.7% as of December 31, 2001 and 2000, respectively.
We expect to maintain our debt-to-total-capital ratio between 25% and 30%. Within this range, we believe
our cost of capital and return on shareholders’ equity are optimized, while maintaining a prudent level of
leverage and liquidity.
Commercial paper outstanding at December 31, 2001, totaled $684 million, with interest rates ranging
from 1.9% to 2.7%. In November 2001, we issued $100 million of floating-rate notes due November 2003 and
$150 million of floating-rate notes due November 2004. The interest rates on the notes are reset quarterly to