United Healthcare 2001 Annual Report Download - page 25
Download and view the complete annual report
Please find page 25 of the 2001 United Healthcare annual report below. You can navigate through the pages in the report by either clicking on the pages listed below, or by using the keyword search tool below to find specific information within the annual report.-
 1
1 -
2
-
3
-
4
-
5
-
6
-
7
-
8
-
9
-
10
-
11
-
12
-
13
-
14
-
 15
15 -
 16
16 -
 17
17 -
 18
18 -
 19
19 -
 20
20 -
 21
21 -
 22
22 -
 23
23 -
 24
24 -
 25
25 -
 26
26 -
 27
27 -
 28
28 -
 29
29 -
 30
30 -
 31
31 -
 32
32 -
 33
33 -
 34
34 -
 35
35 -
36
-
37
-
38
-
39
-
40
-
41
-
42
-
43
-
44
-
45
-
46
-
47
-
48
-
49
-
50
-
51
-
52
-
53
-
54
-
55
-
56
-
57
-
58
-
59
-
60
-
61
-
62
 |
 |

PAGE 24 UnitedHealth Group
Operating Costs
Operating costs as a percentage of total revenues (the operating cost ratio) was 17.0% in 2001, compared
with 16.7% in 2000. Changes in productivity and revenue mix affect the operating cost ratio. For our fastest-
growing businesses (Uniprise, Specialized Care Services, Ingenix and Ovations Pharmacy Services), most
direct costs of revenue are included in operating costs, not medical costs. Using a revenue mix comparable
to 2000, the 2001 operating cost ratio would have decreased 70 basis points to 16.0%. This decrease was
principally driven by productivity gains from process improvements, technology deployment and cost
management initiatives, primarily in the areas of claim processing and customer billings and enrollment.
Additionally, because our infrastructure can be scaled efficiently, we have been able to grow revenues at a
proportionately higher rate than associated expenses.
On an absolute dollar basis, operating costs increased by $459 million, or 13%, over 2000. This
increase reflects additional costs to support product and technology development initiatives and
the 11% increase in consolidated revenues in 2001, partially offset by productivity and technology
improvements discussed above.
Depreciation and Amortization
Depreciation and amortization was $265 million in 2001 and $247 million in 2000. This increase resulted
primarily from higher levels of capital expenditures to support business growth and technology enhance-
ments, as well as the amortization of goodwill and other intangible assets related to acquisitions.
Income Taxes
The 2000 income tax provision includes nonrecurring tax benefits primarily related to the contribution
of UnitedHealth Capital investments to the UnitedHealth Foundation. Excluding nonrecurring tax
benefits, our effective income tax rate was 38.0% in 2001 and 37.5% in 2000.
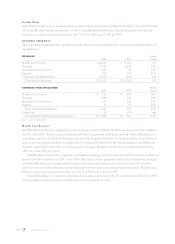
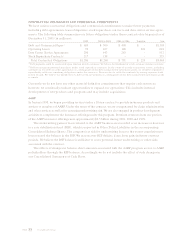
BUSINESS SEGMENTS
The following summarizes the operating results of our business segments for the years ended December 31
(in millions):
REVENUES
Percent
2 0 0 1 2000 Change
Health Care Services
$20,494
$18,696 10%
Uniprise
2,462
2,140 15%
Specialized Care Services
1,254
974 29%
Ingenix
447
375 19%
Corporate and Eliminations
(1,203)
(1,063) nm
Consolidated Revenues
$23,454
$21,122 11%
EARNINGS FROM OPERATI ONS
Percent
2 0 0 1 2000 Change
Health Care Services
$944
$739 28%
Uniprise
374
289 29%
Specialized Care Services
214
174 23%
Ingenix
48
32 50%
Total Operating Segments
1,580
1,234 28%
Corporate
(14)
(34) nm
Consolidated Earnings from Operations
$1,566
$1,200 31%
nm — not meaningful