TomTom 2012 Annual Report Download - page 9
Download and view the complete annual report
Please find page 9 of the 2012 TomTom annual report below. You can navigate through the pages in the report by either clicking on the pages listed below, or by using the keyword search tool below to find specific information within the annual report.-
 1
1 -
 2
2 -
 3
3 -
 4
4 -
 5
5 -
 6
6 -
 7
7 -
 8
8 -
 9
9 -
 10
10 -
 11
11 -
 12
12 -
 13
13 -
 14
14 -
 15
15 -
 16
16 -
 17
17 -
 18
18 -
 19
19 -
 20
20 -
21
-
22
-
23
-
24
-
25
-
26
-
27
-
28
-
29
-
30
-
31
-
32
-
33
-
34
-
35
-
36
-
37
-
38
-
39
-
40
-
41
-
42
-
43
-
44
-
45
-
46
-
47
-
48
-
49
-
50
-
51
-
52
-
53
-
54
-
55
-
56
-
57
-
58
-
59
-
60
-
61
-
62
-
63
-
64
-
65
-
66
-
67
-
68
-
69
-
70
-
71
-
72
-
73
-
74
-
75
-
76
-
77
-
78
-
79
-
80
-
81
-
82
-
83
-
84
 |
 |
7
Licensing
In the Licensing segment our revenue declined from €142 million
in 2011 to €133 million in 2012, as a result of weaker sales to our
third party PND and internet and mobile customers. We grew our
sales to the GIS (geographical information system) market during
the year. We demonstrated our commitment to the GIS markets
by making our map database available in Esri’s fi le geodatabase
format and by being the fi rst to come to the market with fully
map-integrated 2010 US Census boundary data. We provide GIS
professionals with seamless access to rich Census information for
a variety of purposes, including geocoding, geo-marketing, site
selection, and comprehensive demographic studies.
We continued to expand our maps coverage to more than
200 countries and territories globally, achieving navigable coverage
in 112 countries and of 36.5 million kilometres of roads.
We had several announcements in the highly dynamic smartphone
arena – a deal with Apple, who will license our maps and related
content. Samsung decided to use our maps on its Wave3 smart
phone, and RIM selected our real-time traffi c service for BlackBerry
applications.
In the year we won a good number of deals for our real-time
and historical traffi c information. These included the Automobile
Association in the UK and the cities of Berlin and Rome. Working
with our local partner Autonavi, we began offering real-time
traffi c information services to the Chinese market.
We also launched a new Location Based Services (LBS) Platform
and Developer Portal. This enables cloud-based LBS Platform
developers to access TomTom’s location and navigation services
– including map display, routing, traffi c and geocoding – in order
to create location-enabled applications for a variety of commercial
and consumer markets.
Business Solutions
Business Solutions showed double digit growth during the year
and generated revenue of €73 million. At the end of the year
Business Solutions had 19,000 customers, the largest managed
fl eet management systems customer base in the world, and an
installed base of 239,000 subscribers. This compares to 15,000
customers and an installed base of 180,000 subscribers at the end
of 2011.
A new generation of WEBFLEET was introduced in the year.
WEBFLEET customers were offered new reporting tools and a
dispatching feature that helps businesses to respond more rapidly
to customers. Some 87% of consumers experience late arrivals or
deliveries from tradesmen and delivery fi rms. WEBFLEET services
can now offer a signifi cant competitive advantage to service and
delivery companies.
During the year, Business Solutions began to leverage its
technological capabilities further by moving into the insurance
and car leasing markets. The unit supplies the technology to
support
a new insurance product that bases premiums on
driving behaviour.
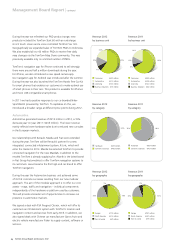
Content & Services revenue reduced slightly from €407 million
in 2011 to €400 million in 2012, or 38% of group revenue
(2011: 32%). Licensing and Automotive map revenue decreased
but we saw strong growth in Consumer’s LIVE Services
subscriptions revenue and also higher WEBFLEET revenue in
Business Solutions.
Revenue generated in EMEA accounted for 73% (2011:74%) of
group revenue, while North America and the rest of the world
contributed 20% (2011: 20%) and 7% (2011: 6%) respectively.
Gross result
—
The gross result decreased by 13% from €640 million in 2011
to €555 million in 2012 because of the decline in revenue.
The gross margin increased by 2 percentage points to 52%
year-on-year (2011: 50%), due to the higher proportion of
Content & Services revenue in the overall revenue mix. The costs
associated with rectifying a product issue and one-off releases
in our provision balanced each other out, and together did not
impact the gross margin.
Operating expenses
—
Total operating expenses for the year amounted to €484 million,
a decrease of €580 million compared to 2011. Excluding the
impact of a €512 million impairment charge and €15 million
of restructuring charges recorded in 2011, the decrease was
€53 million. This refl ected the success of cost reduction
programmes across the company.
R&D expenses declined by 4% from €173 million to
€166 million (2011: €167 million excluding restructuring
charges). We maintained our investment in R&D despite
the overall reduction in operating costs. We focused our
investments on our core technology assets and projects that
support our modular product offering strategy.
Marketing expenses decreased by 27% year-on-year from
€78 million to €57 million (2011: €77 million excluding
restructuring charges). While we scaled down our marketing
spend this year in line with Consumer revenue development,
we focused on campaigns on increasing awareness of the
quality of our maps and traffi c information.