TomTom 2012 Annual Report Download - page 80
Download and view the complete annual report
Please find page 80 of the 2012 TomTom annual report below. You can navigate through the pages in the report by either clicking on the pages listed below, or by using the keyword search tool below to find specific information within the annual report.-
 1
1 -
2
-
3
-
4
-
5
-
6
-
7
-
8
-
9
-
10
-
11
-
12
-
13
-
14
-
15
-
16
-
17
-
18
-
19
-
20
-
21
-
22
-
23
-
24
-
25
-
26
-
27
-
28
-
29
-
30
-
31
-
32
-
33
-
34
-
35
-
36
-
37
-
38
-
39
-
40
-
41
-
42
-
43
-
44
-
45
-
46
-
47
-
48
-
49
-
50
-
51
-
52
-
53
-
54
-
55
-
56
-
57
-
58
-
59
-
60
-
61
-
62
-
63
-
64
-
65
-
66
-
67
-
68
-
69
-
 70
70 -
 71
71 -
 72
72 -
 73
73 -
 74
74 -
 75
75 -
 76
76 -
 77
77 -
 78
78 -
 79
79 -
 80
80 -
 81
81 -
 82
82 -
 83
83 -
 84
84
 |
 |

TomTom Annual Report and Accounts 2012
78
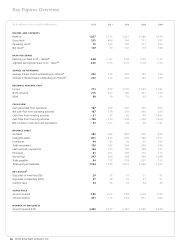
Key Figures Overview
(in € millions, unless stated otherwise) 2012 2011 2010 2009 2008
INCOME AND EXPENSES
Revenue 1,057 1,273 1,521 1,480 1,674
Gross result 555 640 744 731 781
Operating result170 102 190 231 264
Net result2129 74 110 94 188
DATA PER SHARE
Earnings per share (in €) – diluted3 0.58 – 1.97 0.49 0.47 1.17
Adjusted earnings per share (in €) – basic3, 4 0.40 0.55 0.70 0.78 1.50
SHARES OUTSTANDING
Average # basic shares outstanding (in millions)3 222 222 222 184 148
Average # diluted shares outstanding (in millions)3 222 222 222 185 149
REGIONAL REVENUE SPLIT
Europe 773 937 1,070 1,007 1,182
North America 215 257 380 411 434
ROW 69 79 70 62 59
CASH FLOW
Cash generated from operations 187 195 265 430 463
Net cash fl ow from operating activities 167 174 210 340 354
Cash fl ow from investing activities – 51 – 73 – 65 – 90 – 1,903
Cash fl ow from fi nancing activities – 146 – 214 – 209 – 206 1,408
Net increase in cash and cash equivalents – 30 – 112 – 64 45 – 142
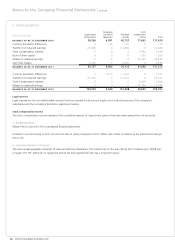
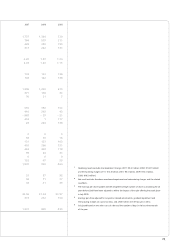
BALANCE SHEET
Goodwill 382 382 855 855 855
Intangible assets 821 872 946 986 1,011
Inventories 44 66 94 67 145
Trade receivables 150 185 306 294 290
Cash and cash equivalents 164 194 306 368 321
Provisions 81 101 109 114 113
Borrowings 247 384 588 790 1,388
Trade payables 84 117 218 201 152
Total equity and liabilities 1,724 1,799 2,623 2,686 2,767
KEY RATIOS5
Days sales of inventory (DSI) 29 31 31 21 47
Days sales outstanding (DSO) 47 48 55 51 51
Creditor days 54 56 72 64 49
SHARE PRICE
At end of period 3.80 3.05 7.89 6.25 4.30
Volume (million) 491 715 552 811 480
NUMBER OF EMPLOYEES
At end of period (FTE) 3,490 3,677 3,487 3,089 3,498