TomTom 2012 Annual Report Download - page 51
Download and view the complete annual report
Please find page 51 of the 2012 TomTom annual report below. You can navigate through the pages in the report by either clicking on the pages listed below, or by using the keyword search tool below to find specific information within the annual report.-
 1
1 -
2
-
3
-
4
-
5
-
6
-
7
-
8
-
9
-
10
-
11
-
12
-
13
-
14
-
15
-
16
-
17
-
18
-
19
-
20
-
21
-
22
-
23
-
24
-
25
-
26
-
27
-
28
-
29
-
30
-
31
-
32
-
33
-
34
-
35
-
36
-
37
-
38
-
39
-
40
-
 41
41 -
 42
42 -
 43
43 -
 44
44 -
 45
45 -
 46
46 -
 47
47 -
 48
48 -
 49
49 -
 50
50 -
 51
51 -
 52
52 -
 53
53 -
 54
54 -
 55
55 -
 56
56 -
 57
57 -
 58
58 -
 59
59 -
 60
60 -
 61
61 -
62
-
63
-
64
-
65
-
66
-
67
-
68
-
69
-
70
-
71
-
72
-
73
-
74
-
75
-
76
-
77
-
78
-
79
-
80
-
81
-
82
-
83
-
84
 |
 |

49
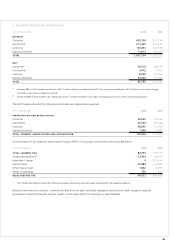
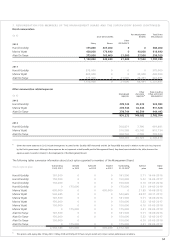
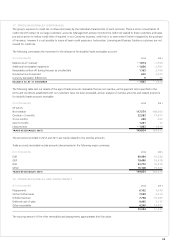
5. SEGMENT REPORTING (CONTINUED)
(€ in thousands) 2012 2011
REVENUE
Consumer 639,106 832,714
Automotive 211,952 234,755
Licensing 133,063 142,188
Business Solutions 73,013 63,560
TOTAL 1,057,134 1,273,217
EBIT
Consumer140,516 86,312
Automotive29,412 4,001
Licensing 8,299 12,702
Business Solutions 24,566 12,902
TOTAL 82,793 115,917
1 Consumer EBIT in 2012 includes one-off costs of €11.7 million relating to a malfunctioning GPS chip issue and a one-off gain of €10.5 million as a result of a change
of estimate in our claims and litigation provision.
2 Automotive EBIT in 2012 includes a €7.2 million gain due to a change of estimate in our claims and litigation provision as well as our warranty provision.
The EBIT measure includes the following amortisation and depreciation expenses:
(€ in thousands) 2012 2011
AMORTISATION AND DEPRECIATION
Consumer 20,063 27,629
Automotive 40,764 38,386
Licensing 48,295 51,635
Business Solutions 1,548 1,447
TOTAL SEGMENT AMORTISATION AND DEPRECIATION 110,670 119,097
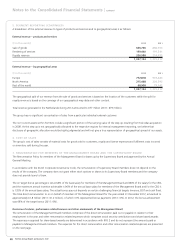
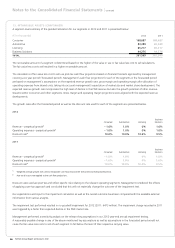
A reconciliation of the segments performance measure (EBIT) to the group’s result before tax is provided below.
(€ in thousands) 2012 2011
TOTAL SEGMENT EBIT 82,793 115,917
Unallocated expenses1– 12,544 – 28,650
Impairment charge 0– 511,936
Interest result – 12,084 – 21,862
Other fi nance result 1,642 6,093
Result of associates 726 – 432
RESULT BEFORE TAX 60,533 – 440,870
1 2011 Unallocated expense includes €14 million group-wide restructuring costs which were not allocated to the operating segments.
Revenue from external customers is derived primarily from the sale of portable navigation devices and in-dash navigation systems
and related content and services and the royalty income generated from licensing our map database.