Tesco 2004 Annual Report Download - page 3
Download and view the complete annual report
Please find page 3 of the 2004 Tesco annual report below. You can navigate through the pages in the report by either clicking on the pages listed below, or by using the keyword search tool below to find specific information within the annual report.-
 1
1 -
 2
2 -
 3
3 -
 4
4 -
 5
5 -
 6
6 -
 7
7 -
 8
8 -
 9
9 -
 10
10 -
 11
11 -
 12
12 -
 13
13 -
 14
14 -
15
-
16
-
17
-
18
-
19
-
20
-
21
-
22
-
23
-
24
-
25
-
26
-
27
-
28
-
29
-
30
-
31
-
32
-
33
-
34
-
35
-
36
-
37
-
38
-
39
-
40
-
41
-
42
-
43
-
44
-
45
-
46
-
47
-
48
-
49
-
50
-
51
-
52
-
53
-
54
-
55
-
56
-
57
-
58
-
59
-
60
 |
 |

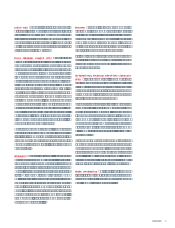
TESCO PLC 1
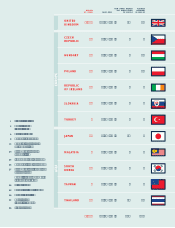
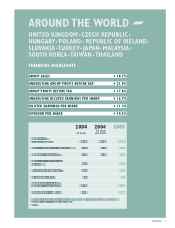
AROUND THE WORLD
UNITED KINGDOM·CZECH REPUBLIC·
HUNGARY·POLAND·REPUBLIC OF IRELAND·
SLOVAKIA·TURKEY·JAPAN·MALAYSIA·
SOUTH KOREA·TAIWAN·THAILAND
FINANCIAL HIGHLIGHTS
2004 2004 2003
52 weeks
53 weeks pro forma .
Group sales (£m)
(including value added tax) 33,557 32,989 28,280
Underlying Group profit before tax(£m) 1,708 1,684 1,401
Group profit before tax (£m) 1,600 1,576 1,361
Underlying diluted earnings
per share(p) 16.31 13.98
Diluted earnings per share (p) 14.93 13.42
Dividend per share (p) 6.84 6.20
Group enterprise value (£m)
(market capitalisation plus net debt) 23,866 16,896
Return on capital employed 10.5% 10.2%
Excluding net loss on disposal of fixed assets £9m (2003 £13m), integration costs £45m (2003 £4m)
and goodwill amortisation £54m (2003 £23m).
Restated
GROUP SALES + 18.7%
UNDERLYING GROUP PROFIT BEFORE TAX†+ 21.9%
GROUP PROFIT BEFORE TAX + 17.6%
UNDERLYING DILUTED EARNINGS PER SHARE†+ 16.7%
DILUTED EARNINGS PER SHARE + 11.3%
DIVIDEND PER SHARE + 10.3%