Tesco 1998 Annual Report Download - page 42
Download and view the complete annual report
Please find page 42 of the 1998 Tesco annual report below. You can navigate through the pages in the report by either clicking on the pages listed below, or by using the keyword search tool below to find specific information within the annual report.-
 1
1 -
2
-
3
-
4
-
5
-
6
-
7
-
8
-
9
-
10
-
11
-
12
-
13
-
14
-
15
-
16
-
17
-
18
-
19
-
20
-
21
-
22
-
23
-
24
-
25
-
26
-
27
-
28
-
29
-
30
-
31
-
 32
32 -
 33
33 -
 34
34 -
 35
35 -
 36
36 -
 37
37 -
 38
38 -
 39
39 -
 40
40 -
 41
41 -
 42
42 -
 43
43 -
 44
44 -
 45
45
 |
 |

4 0
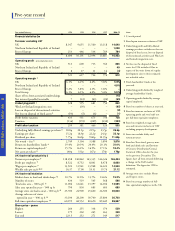
Five-year record
Year ended February
Financial statistics £m
Turnover excluding VAT
UK
Northern Ireland and Republic of Ireland
Rest of Europe
Operating profit – pre-integration costs
UK
Northern Ireland and Republic of Ireland
Rest of Europe
Operating margin 2
UK
Northern Ireland and Republic of Ireland
Rest of Europe
Total Group
Share of loss from associated undertakings
Net interest (payable)/receivable
Underlying profit 3
Wm Low/Ireland integration costs
Loss on disposal of discontinued activities
Net loss on disposal of fixed assets 4
Profit before taxation
Taxation
Profit after taxation
Underlying fully diluted earnings per share 3
Earnings per share
Dividend per share
Net worth – £m 5
Return on shareholders’ funds 6
Return on capital employed 7
Net assets per share 8
UK food retail productivity £
Turnover per employee 9
Profit per employee 9
Wages per employee 9
Weekly sales per sq ft 10/11
UK food retail statistics
Market share in food and drink shops 12
Number of stores
Total sales area – ’000 sq ft 11
Sales area opened in year – ’000 sq ft
Average store size (sales area) – ’000 sq ft 13
Average sales area of stores
opened in year – ’000 sq ft 13
Full-time equivalent employees 14
Share price – pence
Highest
Lowest
Year end
1994
8,347
–
253
8,600
513
–
8
521
6.1%
–
3.2%
6.1%
–
7
528
–
–
(93)
435
(136)
299
18.8p
15.2p
7.75p
2,749
19.4%
15.7%
140p
138,658
8,522
13,922
16.37
10.7%
430
11,006
790
25,700
33,100
60,199
260
179
223.5
1995
9,655
–
446
10,101
600
–
17
617
6.2%
–
3.8%
6.1%
–
(22)
595
(39)
–
(5)
551
(170)
381
20.1p
18.9p
8.60p
3,104
20.3%
16.2%
151p
140,842
8,752
13,941
17.00
12.0%
519
12,641
830
24,900
28,200
68,552
255
202
252
1996
11,560
–
534
12,094
713
–
11
724
6.2%
–
2.1%
6.0%
–
(43)
681
–
–
(6)
675
(209)
466
21.9p
22.2p
9.60p
3,588
20.4%
16.9%
167p
143,335
8,841
13,948
18.31
13.7%
545
13,397
685
25,600
30,700
80,650
338
245
271
1997
13,118
–
769
13,887
760
–
14
774
5.8%
–
1.8%
5.6%
–
(24)
750
–
–
–
750
(230)
520
23.5p
24.1p
10.35p
3,890
20.1%
17.1%
179p
146,326
8,478
14,222
19.74
14.6%
568
14,036
603
26,300
25,800
89,649
370
263
349
1998 (1)
14,640
1,028
784
16,452
866
49
(3)
912
5.9%
4.8%
–
5.5%
(15)
(65)
832
(95)
(8)
(1)
728
(223)
505
26.6p
23.1p
11.60p
3,876
21.4%
18.4%
176p
146,404
8,660
14,500
21.12
15.2%
586
14,585
680
26,600
26,700
99,997
539
339
517
Notes
153 week period.
2Based upon turnover exclusive of VAT.
3Underlying profit and fully diluted
earnings per share excludes net loss on
disposal of fixed assets, loss on disposal
of discontinued activities and Wm Low
and Ireland integration costs.
4Net loss on the disposal of fixed
assets for 1994 includes £85m in
respect of the write down of surplus
development sites to their estimated
net realisable value.
5Total shareholders’ funds at the
year end.
6Underlying profit divided by weighted
average shareholders’ funds.
7Operating profit divided by average
capital employed.
8Based on number of shares at year end.
9Based on turnover exclusive of VAT,
operating profit and total staff cost
per full-time equivalent employee.
10 Based on weighted average sales
area and turnover inclusive of VAT
excluding property development.
11 Store sizes exclude lobby and
restaurant areas.
12 Based on Tesco food, grocery, non-
food and drink sales and Institute
of Grocery Distribution/Central
Statistical Office data for the year
to the previous December. The
figures have all been restated following
a change in the IGD market
definition. The figure for 1998 is
estimated.
13 Average store sizes exclude Metro
and Express stores.
14 Based on average number of full-
time equivalent employees in the UK.