Tesco 1998 Annual Report Download - page 32
Download and view the complete annual report
Please find page 32 of the 1998 Tesco annual report below. You can navigate through the pages in the report by either clicking on the pages listed below, or by using the keyword search tool below to find specific information within the annual report.-
 1
1 -
2
-
3
-
4
-
5
-
6
-
7
-
8
-
9
-
10
-
11
-
12
-
13
-
14
-
15
-
16
-
17
-
18
-
19
-
20
-
21
-
 22
22 -
 23
23 -
 24
24 -
 25
25 -
 26
26 -
 27
27 -
 28
28 -
 29
29 -
 30
30 -
 31
31 -
 32
32 -
 33
33 -
 34
34 -
 35
35 -
 36
36 -
 37
37 -
 38
38 -
 39
39 -
 40
40 -
 41
41 -
 42
42 -
43
-
44
-
45
 |
 |

Weighted average
time for which
rate is fixed
Years
6
4
–
5
6
3 0
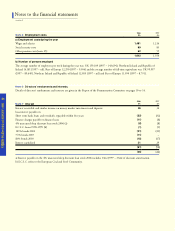
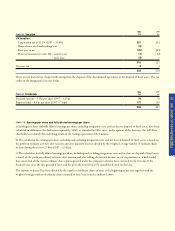
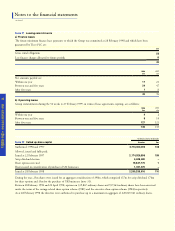
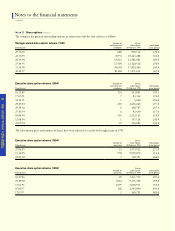
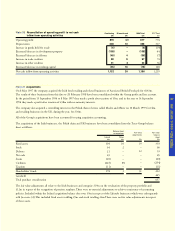
Note 18 Net debt
Due within one year
Bank and other loans
Finance leases
Due within one to two years
Bank and other loans
Finance leases
Due within two to five years
Bank and other loans
Finance leases
Due wholly or in part by instalments after five years
Finance leases
Due otherwise than by instalments after five years
Bank and other loans
Gross debt
Less: Cash at bank and in hand
Money market investments and deposits
Net debt
1998
£m
607
17
12
7
422
17
1
333
1,416
29
196
1,191
Group
1997
£m
285
21
13
19
33
28
8
487
894
65
80
749
1998
£m
1,263
–
3
–
400
–
–
333
1,999
–
2
1,997
Company
1997
£m
931
–
8
–
–
–
–
480
1,419
–
2
1,417
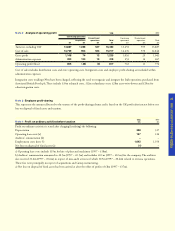
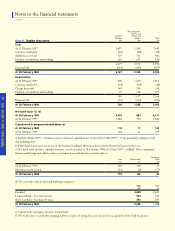
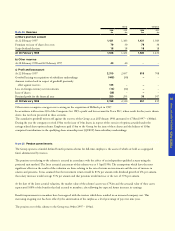
Currency
Sterling
Irish punt
Other
Net debt at 28 February 1998
% of net debt
Net debt at 22 February 1997
Fixed rate
debt
£m
456
158
–
614
52%
310
Floating rate
debt
£m
658
(66)
(15)
577
48%
439
Total
£m
1,114
92
(15)
1,191
749
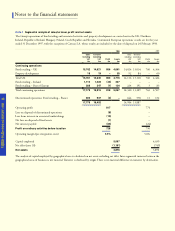
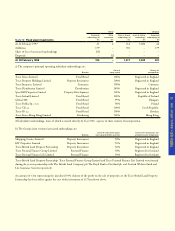
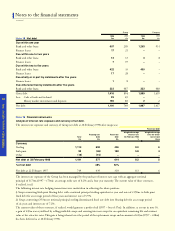
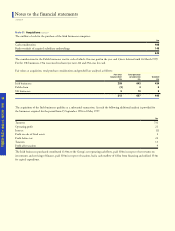
Note 19 Financial instruments
Analysis of interest rate exposure and currency of net debt.
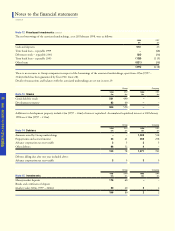
The interest rate exposure and currency of Group net debt at 28 February 1998 after swaps was:
The interest rate exposure of the Group has been managed by the purchase of interest rate caps with an aggregate notional
principal of £170m (1997 – £70m), an average strike rate of 8.2% and a four year maturity. The current value of these contracts,
if realised, is nil.
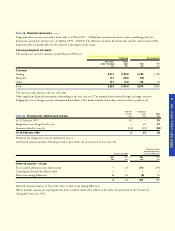
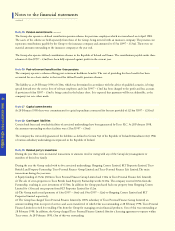
The following interest rate hedging transactions were undertaken in achieving the above position:
i) Swaps converting Irish punt floating debt, with a notional principal sterling equivalent at year end rates of £158m, to Irish punt
fixed debt for an average period of four years and interest rate of 5.9%.
ii) Swaps converting £353m net notional principal sterling denominated fixed rate debt into floating debt for an average period
of six years and interest rate of 7.2%.
The current value of these contracts, if realised, would generate a profit of nil (1997 – loss of £7m). In addition, as set out in note 16,
a gain of £45m was crystallised by selling profitable swaps and entering into new swaps for an equivalent remaining life and contract
value at less attractive rates. This gain is being released over the period of the replacement swaps and an amount of £23m (1997 – £28m)
has been deferred as at 28 February 1998.
Notes to the financial statements
c o n t i n u e d
Weighted average
interest rate
28 February 1998
%
9.0
5.9
–
8.2
8.3
Fixed rate debt