Tesco 1998 Annual Report Download - page 3
Download and view the complete annual report
Please find page 3 of the 1998 Tesco annual report below. You can navigate through the pages in the report by either clicking on the pages listed below, or by using the keyword search tool below to find specific information within the annual report.-
 1
1 -
 2
2 -
 3
3 -
 4
4 -
 5
5 -
 6
6 -
 7
7 -
 8
8 -
 9
9 -
 10
10 -
 11
11 -
 12
12 -
 13
13 -
 14
14 -
15
-
16
-
17
-
18
-
19
-
20
-
21
-
22
-
23
-
24
-
25
-
26
-
27
-
28
-
29
-
30
-
31
-
32
-
33
-
34
-
35
-
36
-
37
-
38
-
39
-
40
-
41
-
42
-
43
-
44
-
45
 |
 |

1
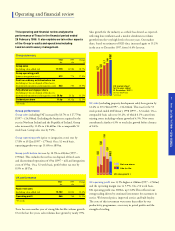
Operating and financial review
This operating and financial review analyses the
performance of Tesco in the financial period ended
28 February 1998. It also explains certain other aspects
of the Group’s results and operations including
taxation and treasury management.
Group summary
1998*1997 Change
£m £m %
Group sales
(including value added tax) 17,779 14,984 18.7%
Group operating profit
(prior to integration costs) 912 774 17.8%
Profit on ordinary activities before tax
( e x cluding net loss on disposal of fixed assets,
discontinued operations and integration costs) 832 750 10.9%
Fully diluted earnings per share
( e x cluding net loss on disposal of fixe da s s e t s ,
discontinued operations and integration costs) 26.6p 23.5p 13.2%
Dividend per share 11.6p 10.35p 12.1%
*53 weeks
Group performance
G roup sales including VAT increased by 18.7% to £17,779m
(1997 – £14,984m). Excluding the businesses acquired in the
year in Northern Ireland and the Republic of Ireland, Group
sales increased by 11.2% to £16,669m. On a comparable 52
week basis, Group sales rose by 9.2%.
G roup operating profit (prior to integration costs) rose by
17.8% to £912m (1997 – £774m). On a 52 week basis,
operating profits were up 15.6% to £895m.
G roup profit befo re tax rose by 10.9% to £832m (1997 –
£750m). This excludes the net loss on disposal of fixed assets
and discontinued operations of £9m (1997 – nil) and integration
costs of £95m. On a 52 week basis, profit before tax rose by
8.9% to £817m.
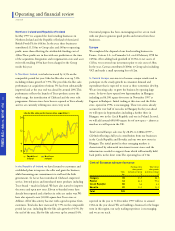
UK performance
1998*1997 Change
£m £m %
Food retail sales
(including value added tax) 15,762 14,024 12.4%
Operating profit 866 760 13.9%
*53 weeks
U K sales ( e x cluding pro p e rty development sales) have grown by
12.4% to £15 , 7 6 2 m (1997 – £14,024m). This was for the 53
week period ended 28 February 1998 (1997 – 52 weeks). On a
comparable basis sales rose 10.2%, of which 6.1% came from
existing stores including volume growth of 4.5%. New stores
contributed a further 4.5% to total sales growth before closures
of 0.4%.
U K operating profit was 13.9% higher at £866m (1997 – £760m)
and the operating margin rose to 5.9%. On a 52 week basis,
UK operating profit was £850m, up 11.8%.This reflected our
strong trading driven by continued investment for customers in
service. We lowered prices, improved service and built loyalty.
The costs of this investment were more than offset by our
productivity programmes, a recovery in petrol profits and the
strength of sterling.
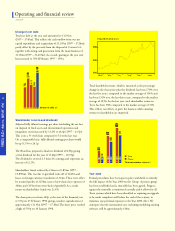
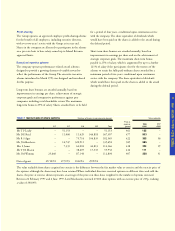
94 95 96 97 98 U K sales growth %
L i ke- for- l i ke
Net new store s
94 95 96 97 98
UK market share *
for the year ended
31 December 1997 %
s o u rc e : I G D/ Te s c o
* e s t i m a t e d
*
Sales growth for the industry as a whole has slowed, as expected,
reflecting lower inflation and a modest slowdown in volume
growth from the very high levels of recent years. Our market
share, based on estimates of IGD data, increased again to 15.2%
in the year to December 1997, from 14.6% last year.
Tesco has seen another year of strong like-for-like volume grow t h .
Over the last five years, sales volumes have grown by nearly 19%.