Tesco 1998 Annual Report Download - page 24
Download and view the complete annual report
Please find page 24 of the 1998 Tesco annual report below. You can navigate through the pages in the report by either clicking on the pages listed below, or by using the keyword search tool below to find specific information within the annual report.-
 1
1 -
2
-
3
-
4
-
5
-
6
-
7
-
8
-
9
-
10
-
11
-
12
-
13
-
 14
14 -
 15
15 -
 16
16 -
 17
17 -
 18
18 -
 19
19 -
 20
20 -
 21
21 -
 22
22 -
 23
23 -
 24
24 -
 25
25 -
 26
26 -
 27
27 -
 28
28 -
 29
29 -
 30
30 -
 31
31 -
 32
32 -
 33
33 -
 34
34 -
35
-
36
-
37
-
38
-
39
-
40
-
41
-
42
-
43
-
44
-
45
 |
 |

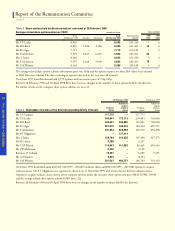
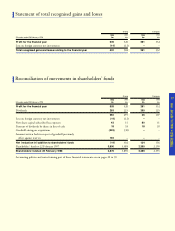
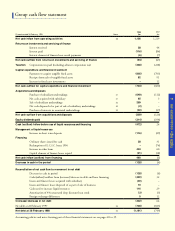
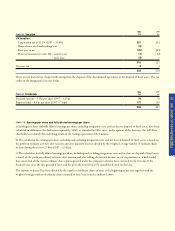
Notes to the financial statements
2 2
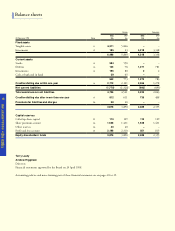
The analysis of capital employed by geographical area is calculated on net assets excluding net debt. Inter-segmental turnover between the
geographical areas of business is not material. Tu r n over is disclosed by origin.T h e re is no material difference in turnover by destination.
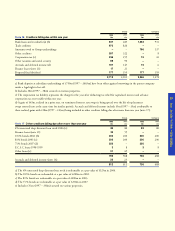
Note 1 Segmental analysis of sales,turnover, profit and net assets
The Gro u p’s operations of food retailing and associated activities and pro p e rty development are carried out in the UK, No rt h e r n
Ireland, Republic of Ireland, Hu n g a r y, Poland, Czech Republic and Slovakia. Continental European operations’ results are for the year
ended 31 December 1997, with the exception of Catteau S.A. whose results are included to the date of disposal on 24 February 1998.
Continuing operations
Food retailing – UK
Property development
Total UK
Food retailing – Ireland
Food retailing – Rest of Europe
Total continuing operations
Discontinued operations: Food retailing – France
Operating profit
Loss on disposal of discontinued operations
Loss from interests in associated undertakings
Net loss on disposal of fixed assets
Net interest payable
Profit on ordinary activities before taxation
Operating margin (pre-integration costs)
Capital employed
Net debt (note 18)
Net assets
Profit
£m
760
–
760
–
3
763
11
774
–
–
–
(24)
750
5.6%
Turnover
excluding
VAT
£m
13,034
84
13,118
–
191
13,309
578
13,887
Sales
including
VAT
£m
14,024
92
14,116
–
224
14,340
644
14,984
1998
Assets
£m
4,661
55
4,716
227
124
5,067
–
5,067
(1,191)
3,876
Profit
£m
866
–
866
(46)
(1)
819
(2)
817
(8)
(15)
(1)
(65)
728
5.5%
Turnover
excluding
VAT
£m
14,621
19
14,640
1,028
247
15,915
537
16,452
Sales
including
VAT
£m
15,762
19
15,781
1,110
288
17,179
600
17,779
1997
Assets
£m
4,364
60
4,424
–
83
4,507
132
4,639
(749)
3,890