Shutterfly 2013 Annual Report Download - page 51
Download and view the complete annual report
Please find page 51 of the 2013 Shutterfly annual report below. You can navigate through the pages in the report by either clicking on the pages listed below, or by using the keyword search tool below to find specific information within the annual report.-
 1
1 -
2
-
3
-
4
-
5
-
6
-
7
-
8
-
9
-
10
-
11
-
12
-
13
-
14
-
15
-
16
-
17
-
18
-
19
-
20
-
21
-
22
-
23
-
24
-
25
-
26
-
27
-
28
-
29
-
30
-
31
-
32
-
33
-
34
-
35
-
36
-
37
-
38
-
39
-
40
-
 41
41 -
 42
42 -
 43
43 -
 44
44 -
 45
45 -
 46
46 -
 47
47 -
 48
48 -
 49
49 -
 50
50 -
 51
51 -
 52
52 -
 53
53 -
 54
54 -
 55
55 -
 56
56 -
 57
57 -
 58
58 -
 59
59 -
 60
60 -
 61
61 -
62
-
63
-
64
-
65
-
66
-
67
-
68
-
69
-
70
-
71
-
72
-
73
-
74
-
75
-
76
-
77
-
78
-
79
-
80
-
81
-
82
-
83
-
84
-
85
-
86
-
87
-
88
-
89
-
90
-
91
-
92
-
93
-
94
-
95
-
96
-
97
-
98
-
99
-
100
-
101
-
102
-
103
-
104
-
105
-
106
-
107
-
108
-
109
-
110
-
111
-
112
-
113
-
114
-
115
-
116
-
117
-
118
-
119
-
120
-
121
-
122
-
123
-
124
 |
 |
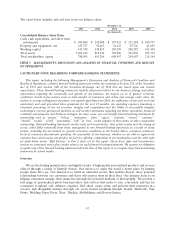
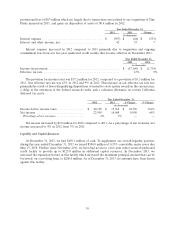
buyers in the second quarter of 2013. The conversion prices of the Notes and the strike price of the
Warrants were set at a 35% and 75% premium, respectively, of the $47.35 price per share of our common
stock at the time of issuance. A portion of the net proceeds from the offering were used to pay the cost of
the convertible note hedge transaction entered into as part of the sale of the Notes, and to repurchase
$30 million of shares of our common stock. In addition, during the fourth quarter of 2013 we exercised the
expansion feature in our credit facility which increased the maximum principal amount that can be
borrowed, on a revolving basis, from $125 million to $200 million.
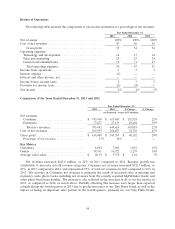
Basis of Presentation
Net Revenues. Our net revenues are comprised of sales generated from Consumer and Enterprise
categories.
Consumer. Our Consumer revenues include sales from all of our brands and are derived from the
sale of photo-based products, such as photo books, stationery and greeting cards, other photo-based
merchandise, photo prints, and the related shipping revenues as well as rental revenue from our
BorrowLenses brand. Included in our photo-based merchandise are items such as mugs, iPhone cases,
mouse pads, desktop plaques and puzzles. Photo prints consist of wallet, 4x6, 5x7, 8x10, and large
format sizes. Revenue from advertising displayed on our websites is also included in Consumer
revenues.
Enterprise. Our Enterprise revenues are primarily from variable, four-color direct marketing
collateral manufactured and fulfilled for business customers. We continue to focus our efforts in
expanding our presence in this market.
Our business is subject to seasonal fluctuations. In particular, we generate a substantial portion of our
revenues during the holiday season in the fourth quarter. We also typically experience increases in net
revenues during other shopping-related seasonal events, such as Easter, Mother’s Day, Father’s Day, and
Halloween. We generally experience lower net revenues during the first, second and third calendar
quarters and have incurred and may continue to incur losses in these quarters. Due to the relatively short
lead time required to fulfill product orders, usually one to three business days, order backlog is not
material to our business.
To further understand net revenue trends in our Consumer category, we monitor several key metrics
including, total customers, total number of orders, and average order value.
Total Customers. We closely monitor total customers as a key indicator of demand. Total
customers represents the number of transacting customers in a given period. We seek to expand our
customer base by empowering our existing customers with sharing and collaboration services, and by
conducting integrated marketing and advertising programs. We also acquire new customers through
customer list acquisitions. Total customers have increased on an annual basis for each year since
inception and we expect this trend to continue.
Total Number of Orders. We closely monitor total number of orders as a leading indicator of net
revenue trends. We recognize net revenues associated with an order when the products have been
shipped and all other revenue recognition criteria have been met. Orders are typically processed and
shipped in approximately three business days after a customer places an order. Total number of orders
has increased on an annual basis for each year since 2000, and we anticipate this trend to continue in
the future.
49