Red Lobster 2000 Annual Report Download - page 43
Download and view the complete annual report
Please find page 43 of the 2000 Red Lobster annual report below. You can navigate through the pages in the report by either clicking on the pages listed below, or by using the keyword search tool below to find specific information within the annual report.-
 1
1 -
2
-
3
-
4
-
5
-
6
-
7
-
8
-
9
-
10
-
11
-
12
-
13
-
14
-
15
-
16
-
17
-
18
-
19
-
20
-
21
-
22
-
23
-
24
-
25
-
26
-
27
-
28
-
29
-
30
-
31
-
32
-
 33
33 -
 34
34 -
 35
35 -
 36
36 -
 37
37 -
 38
38 -
 39
39 -
 40
40 -
 41
41 -
 42
42 -
 43
43 -
 44
44 -
 45
45 -
 46
46 -
 47
47 -
 48
48 -
 49
49 -
 50
50 -
 51
51 -
 52
52 -
 53
53
 |
 |

NOTES TO CONSOLIDATED FINANCIAL STATEMENTS
DARDEN RESTAURANTS
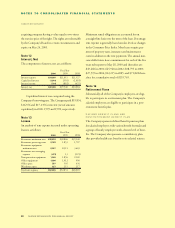
The assumed health care cost trend rate increase in
the per-capita charges for benefits ranged from 5.0 to
6.5 percent for 2001, depending on the medical service
category. The rates gradually decrease to a range of 4.6
to 5.5 percent for 2007 and remain at that level thereafter.
The assumed health care cost trend rate has a sig-
nificant effect on amounts reported for retiree health
care plans. A one-percentage-point increase in the
assumed health care cost trend rate would increase or
decrease the total of the service and interest cost com-
ponents of net periodic post-retirement benefit cost
by $140 and $110, respectively, and would increase or
decrease the accumulated post-retirement benefit
obligation by $1,091 and $ 870, respectively.
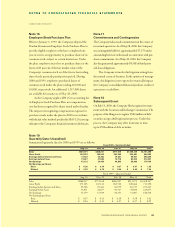
DEFINED CONTRIBUTION PLAN
The Company has a defined contribution plan covering
most employees age 21 and older with at least one year
of service. The Company matches participant contri-
butions up to six percent of compensation on the basis
of Company performance with the match ranging from
a minimum of $0.25 up to $1.00 for each dollar con-
tributed by the participant. The plan had net assets of
$264,127 at May 28, 2000 and $316,846 at May 30,
1999. Expense recognized in 2000, 1999, and 1998
was $3,729, $5,054, and $3,038, respectively. Employ-
ees classified as "highly compensated" under the Inter-
nal Revenue Code are ineligible to participate in this
plan. Amounts due to highly compensated employees
under a separate, nonqualified deferred compensation
plan totaled $44,150 and $32,471 as of May 28, 2000
and May 30, 1999, respectively.
The defined contribution plan includes an
Employee Stock Ownership Plan (ESOP). This ESOP
originally borrowed $50,000 from third parties guaran-
teed by the Company and borrowed $25,000 from the
Company at a variable interest rate. The $50,000 third
party loan was refinanced in 1997 by a commercial
bank’s loan to the Company and a corresponding loan
from the Company to the ESOP. Compensation
expense is recognized as contributions are accrued.
Contributions to the plan, plus the dividends accumu-
lated on the common stock held by the ESOP, are used
to pay principal, interest and expenses of the plan. As
loan payments are made, common stock is allocated to
ESOP participants. In 2000, 1999 and 1998, the
ESOP incurred interest expense of $3,436, $3,203 and
$3,882, respectively, and used dividends received of
$941, $647 and $1,339 and contributions received
from the Company of $9,385, $4,368 and $4,538,
respectively, to pay principal and interest on its debt.
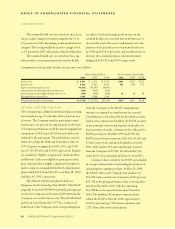
Company shares owned by the ESOP are included
in average common shares outstanding for purposes of
calculating net earnings per share. At May 28, 2000,
the ESOP’s debt to the Company had a balance of
$52,600 with a variable rate of interest of 6.87 percent;
$35,700 of the principal balance is due to be repaid no
later than December 2007, with the remaining
$16,900 due to be repaid no later than December
2014. The number of Company common shares
within the ESOP at May 28, 2000, approximates
10,916, representing 7,989 unreleased shares and
2,927 shares allocated to participants.
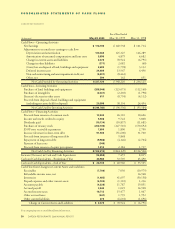
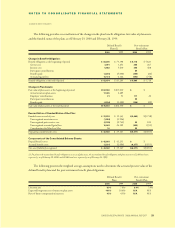
Components of net periodic benefit cost (income) are as follows:
Defined Benefit Plans Post-retirement Benefit Plan
2000 1999 1998 2000 1999 1998
Service cost $ 3,091 $ 3,251 $ 2,576 $260 $267 $225
Interest cost 5,509 5,243 4,699 396 408 375
Expected return on plan assets (10,652) (10,247) (8,865)
Amortization of unrecognized transition asset (642) (642) (642)
Amortization of unrecognized prior service cost (456) (456) (456) 18 18 18
Recognized net actuarial loss 1,405 1,088 1,164
Net periodic benefit cost (income) $ (1,745) $ (1,763) $(1,524) $674 $693 $618
40 DARDEN RESTAURANTS 2000 ANNUAL REPORT