Red Lobster 2000 Annual Report Download - page 33
Download and view the complete annual report
Please find page 33 of the 2000 Red Lobster annual report below. You can navigate through the pages in the report by either clicking on the pages listed below, or by using the keyword search tool below to find specific information within the annual report.-
 1
1 -
2
-
3
-
4
-
5
-
6
-
7
-
8
-
9
-
10
-
11
-
12
-
13
-
14
-
15
-
16
-
17
-
18
-
19
-
20
-
21
-
22
-
 23
23 -
 24
24 -
 25
25 -
 26
26 -
 27
27 -
 28
28 -
 29
29 -
 30
30 -
 31
31 -
 32
32 -
 33
33 -
 34
34 -
 35
35 -
 36
36 -
 37
37 -
 38
38 -
 39
39 -
 40
40 -
 41
41 -
 42
42 -
 43
43 -
44
-
45
-
46
-
47
-
48
-
49
-
50
-
51
-
52
-
53
 |
 |

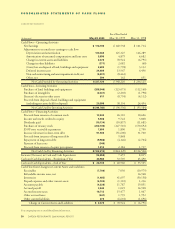
CONSOLIDATED STATEMENTS OF CASH FLOWS
DARDEN RESTAURANTS
Fiscal Year Ended
(In thousands) May 28, 2000 May 30, 1999 May 31, 1998
Cash Flows – Operating Activities
Net Earnings $ 176,705 $ 140,538 $ 101,714
Adjustments to reconcile net earnings to cash flow:
Depreciation and amortization 130,464 125,327 126,289
Amortization of unearned compensation and loan costs 5,895 4,879 4,682
Change in current assets and liabilities 2,472 70,924 (6,791)
Change in other liabilities (371) 2,682 (48)
(Gain) loss on disposal of land, buildings and equipment 2,683 (1,798) 3,132
Deferred income taxes 24,609 13,967 6,496
Non-cash restructuring and asset impairment credit, net (5,931) (8,461)
Other, net 594 162 651
Net Cash Provided by Operating Activities $ 337,120 $ 348,220 $ 236,125
Cash Flows – Investing Activities
Purchases of land, buildings and equipment (268,946) (123,673) (112,168)
Purchases of intangibles (2,431) (2,203) (1,798)
(Increase) decrease in other assets 611 (8,794) (4,112)
Proceeds from disposal of land, buildings and equipment
(including net assets held for disposal) 20,998 38,134 24,494
Net Cash Used by Investing Activities $(249,768) $ (96,536) $ (93,584)
Cash Flows – Financing Activities
Proceeds from issuance of common stock 13,944 26,310 10,606
Income tax benefit credited to equity 5,506 9,722 3,808
Dividends paid (10,134) (10,857) (11,681)
Purchases of treasury stock (202,105) (227,510) (170,692)
ESOP note receivable repayments 7,600 1,800 2,700
Increase (decrease) in short-term debt 91,500 (51,600) 31,700
Proceeds from issuance of long-term debt 9,848
Repayment of long-term debt (9,986) (4,126) (2,704)
Payment of loan costs (349)
Proceeds from issuance of equity put options 1,814 2,184 1,737
Net Cash Used by Financing Activities $(102,210) $(244,229) $(134,526)
Increase (Decrease) in Cash and Cash Equivalents (14,858) 7,455 8,015
Cash and Cash Equivalents – Beginning of Year 40,960 33,505 25,490
Cash and Cash Equivalents – End of Year $ 26,102 $ 40,960 $ 33,505
Cash Flow from Changes in Current Assets and Liabilities
Receivables (7,706) 7,056 (10,979)
Refundable income taxes, net 16,968
Inventories (1,485) 41,697 (50,158)
Prepaid expenses and other current assets (4,184) (1,310) 1,236
Accounts payable (4,238) 11,787 19,851
Accrued payroll 3,540 1,025 14,928
Accrued income taxes 16,712 15,477 1,067
Other accrued taxes (441) 1,793 1,992
Other current liabilities 274 (6,601) (1,696)
Change in Current Assets and Liabilities $ 2,472 $ 70,924 $ (6,791)
See accompanying notes to consolidated financial statements.
30 DARDEN RESTAURANTS 2000 ANNUAL REPORT