Qantas 2004 Annual Report Download - page 7
Download and view the complete annual report
Please find page 7 of the 2004 Qantas annual report below. You can navigate through the pages in the report by either clicking on the pages listed below, or by using the keyword search tool below to find specific information within the annual report.-
 1
1 -
 2
2 -
 3
3 -
 4
4 -
 5
5 -
 6
6 -
 7
7 -
 8
8 -
 9
9 -
 10
10 -
 11
11 -
 12
12 -
 13
13 -
 14
14 -
 15
15 -
 16
16 -
 17
17 -
 18
18 -
19
-
20
-
21
-
22
-
23
-
24
-
25
-
26
-
27
-
28
-
29
-
30
-
31
-
32
-
33
-
34
-
35
-
36
-
37
-
38
-
39
-
40
-
41
-
42
-
43
-
44
-
45
-
46
-
47
-
48
-
49
-
50
-
51
-
52
-
53
-
54
-
55
-
56
-
57
-
58
-
59
-
60
-
61
-
62
-
63
-
64
-
65
-
66
-
67
-
68
-
69
-
70
-
71
-
72
-
73
-
74
-
75
-
76
-
77
-
78
-
79
-
80
-
81
-
82
-
83
-
84
-
85
-
86
-
87
-
88
 |
 |
00
01
02
03
04
11.0
11.0
8.0
8.0
8.0
11.0
9.0
9.0
9.0
9.0
00
01
02
03
04
00
01
02
03
04
00
01
02
03
04
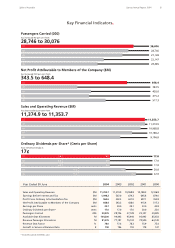
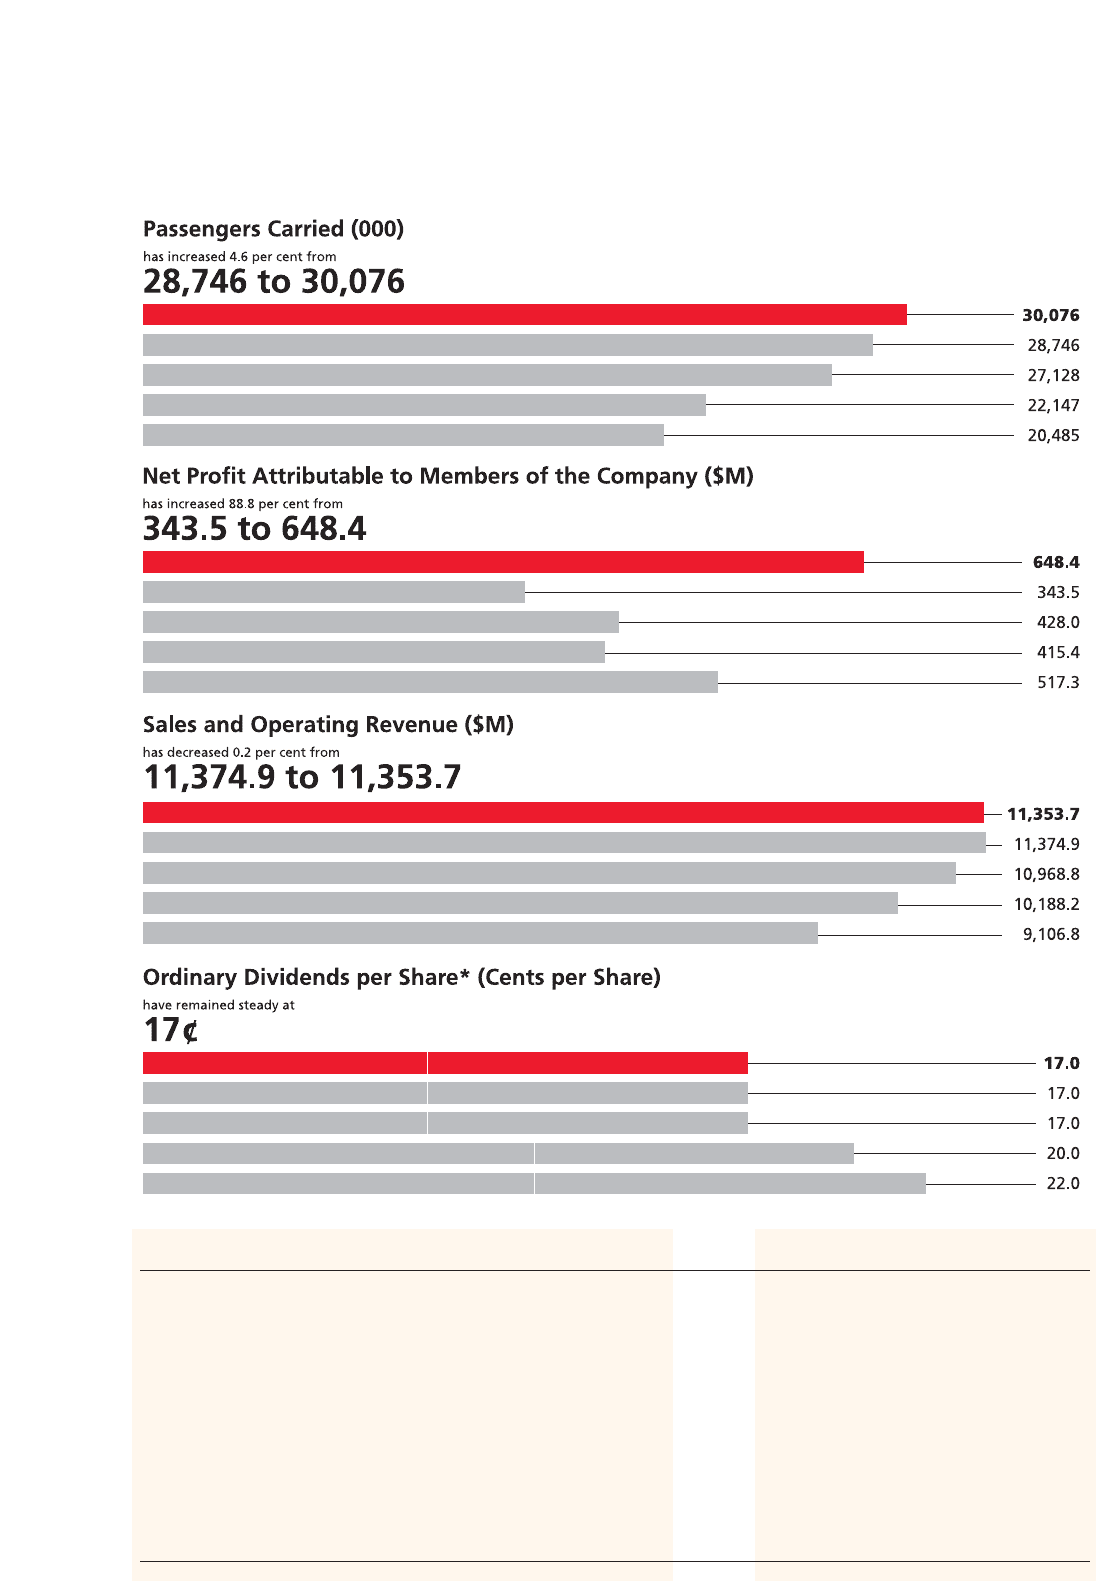
Year Ended 30 June 2004 2003 2002 2001 2000
Sales and Operating Revenue $M 11,353.7 11,374.9 10,968.8 10,188.2 9,106.8
Earnings Before Interest and Tax $M 1,098.2 567.0 679.3 695.8 874.0
Profit From Ordinary Activities Before Tax $M 964.6 502.3 631.0 597.1 762.8
Net Profit Attributable to Members of the Company $M 648.4 343.5 428.0 415.4 517.3
Earnings per Share cents 35.7 20.0 29.1 33.0 42.8
Ordinary Dividends per Share* cents 17.0 17.0 17.0 20.0 22.0
Passengers Carried 000 30,076 28,746 27,128 22,147 20,485
Available Seat Kilometres M 104,200 99,445 95,944 92,943 85,033
Revenue Passenger Kilometres M 81,276 77,187 75,134 70,540 64,149
Revenue Seat Factor % 78.0 77.6 78.3 75.9 75.4
Aircraft in Service at Balance Date # 190 196 193 178 147
* Excludes special dividends paid
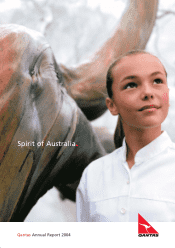
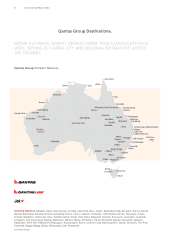
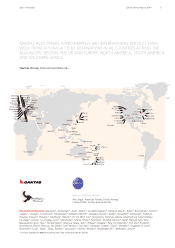
Qantas Annual Report 2004 5Spirit of Australia
Key Financial Indicators