Qantas 2004 Annual Report Download - page 54
Download and view the complete annual report
Please find page 54 of the 2004 Qantas annual report below. You can navigate through the pages in the report by either clicking on the pages listed below, or by using the keyword search tool below to find specific information within the annual report.-
 1
1 -
2
-
3
-
4
-
5
-
6
-
7
-
8
-
9
-
10
-
11
-
12
-
13
-
14
-
15
-
16
-
17
-
18
-
19
-
20
-
21
-
22
-
23
-
24
-
25
-
26
-
27
-
28
-
29
-
30
-
31
-
32
-
33
-
34
-
35
-
36
-
37
-
38
-
39
-
40
-
41
-
42
-
43
-
 44
44 -
 45
45 -
 46
46 -
 47
47 -
 48
48 -
 49
49 -
 50
50 -
 51
51 -
 52
52 -
 53
53 -
 54
54 -
 55
55 -
 56
56 -
 57
57 -
 58
58 -
 59
59 -
 60
60 -
 61
61 -
 62
62 -
 63
63 -
 64
64 -
65
-
66
-
67
-
68
-
69
-
70
-
71
-
72
-
73
-
74
-
75
-
76
-
77
-
78
-
79
-
80
-
81
-
82
-
83
-
84
-
85
-
86
-
87
-
88
 |
 |

Qantas Group
Notes 2004 2003
$M $M
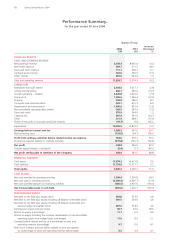
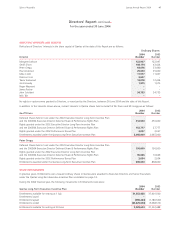
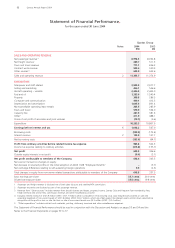
SALES AND OPERATING REVENUE
Net passenger revenue1,2 8,978.3 8,992.8
Net freight revenue1469.7 511.3
Tours and travel revenue 711.1 696.3
Contract work revenue 502.6 530.9
Other sources3,4 692.0 643.6
Sales and operating revenue 211,353.7 11,374.9
EXPENDITURE
Manpower and staff related 2,938.5 3,017.7
Selling and marketing 466.1 546.6
Aircraft operating – variable 2,226.8 2,405.0
Fuel and oil 1,355.6 1,540.4
Property 309.8 286.5
Computer and communication 439.1 412.3
Depreciation and amortisation 1,005.6 891.4
Non-cancellable operating lease rentals 263.5 283.9
Tours and travel 570.9 564.0
Capacity hire 287.4 381.6
Other5411.9 488.1
Share of net profit of associates and joint ventures (19.7) (9.6)
Expenditure 10,255.5 10,807.9
Earnings before interest and tax 61,098.2 567.0
Borrowing costs (259.5) (172.4)
Interest revenue 2125.9 107.7
Net borrowing costs (133.6) (64.7)
Profit from ordinary activities before related income tax expense 964.6 502.3
Income tax expense relating to ordinary activities (315.8) (155.7)
Net profit 648.8 346.6
Outside equity interests in net profit (0.4) (3.1)
Net profit attributable to members of the Company 648.4 343.5
Non-owner transaction changes in equity:
Net decrease in retained profits on the initial adoption of AASB 1028 “Employee Benefits” –(3.7)
Net exchange differences relating to self-sustaining foreign operations 0.4 (2.3)
Total changes in equity from non-owner related transactions attributable to members of the Company 648.8 337.5
Basic earnings per share 35.7 cents 20.0 cents
Diluted earnings per share 35.5 cents 19.8 cents
1 Passenger and freight revenue is disclosed net of both sales discount and interline/IATA commission.
2 Passenger recoveries are disclosed as part of net passenger revenue.
3 Revenue from “Other sources” includes revenue from aircraft charters and leases, property income, Qantas Club and Frequent Flyer membership fees,
freight terminal and service fees, commission revenue, and other miscellaneous income.
4 Excludes interest revenue of $125.9 million (2003: $107.7 million) which is included in net borrowing costs. Also excluded are proceeds on sale and
operating leaseback of non-current assets of $221.8 million (2003: $36.7 million), which are offset against the relevant asset’s written down value before
recognition of the profit or loss on sale. Net loss on sale of non-current assets was $0.5 million (2003: $12.4 million).
5 “Other expenditure” includes contract work materials, printing, stationery, insurance and other miscellaneous expenses.
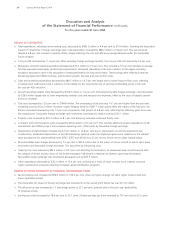
The Statement of Financial Performance should be read in conjunction with the Discussion and Analysis on pages 53 and 54 and the
Notes to the Financial Statements on pages 59 to 77.
Statement of Financial Performance
for the year ended 30 June 2004
52 Qantas Annual Report 2004