Qantas 2004 Annual Report Download - page 55
Download and view the complete annual report
Please find page 55 of the 2004 Qantas annual report below. You can navigate through the pages in the report by either clicking on the pages listed below, or by using the keyword search tool below to find specific information within the annual report.-
 1
1 -
2
-
3
-
4
-
5
-
6
-
7
-
8
-
9
-
10
-
11
-
12
-
13
-
14
-
15
-
16
-
17
-
18
-
19
-
20
-
21
-
22
-
23
-
24
-
25
-
26
-
27
-
28
-
29
-
30
-
31
-
32
-
33
-
34
-
35
-
36
-
37
-
38
-
39
-
40
-
41
-
42
-
43
-
44
-
 45
45 -
 46
46 -
 47
47 -
 48
48 -
 49
49 -
 50
50 -
 51
51 -
 52
52 -
 53
53 -
 54
54 -
 55
55 -
 56
56 -
 57
57 -
 58
58 -
 59
59 -
 60
60 -
 61
61 -
 62
62 -
 63
63 -
 64
64 -
 65
65 -
66
-
67
-
68
-
69
-
70
-
71
-
72
-
73
-
74
-
75
-
76
-
77
-
78
-
79
-
80
-
81
-
82
-
83
-
84
-
85
-
86
-
87
-
88
 |
 |

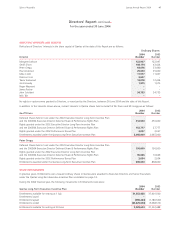
Increase/
Decrease
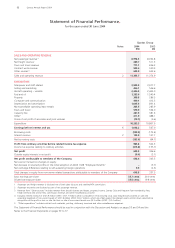
Unit 2004 2003 %
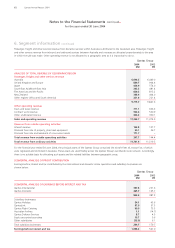
QANTAS GROUP OPERATIONAL STATISTICS
AND PERFORMANCE INDICATORS*
Passengers carried 000 30,076 28,746 4.6
Revenue passenger kilometres (RPKs) M 81,276 77,187 5.3
Available seat kilometres (ASKs) M 104,200 99,445 4.8
Revenue seat factor % 78.0 77.6 0.4 points
Passenger yield (passenger revenue per RPK) cents 10.44 11.15 (6.4)
Average full-time equivalent employees # 33,862 34,872 (2.9)
Aircraft in service at balance date # 190 196 (6) aircraft
Return on total revenue % 5.7 3.0 2.7 points
Return on equity % 11.1 6.5 4.6 points
* A glossary of terms appears on page 43.
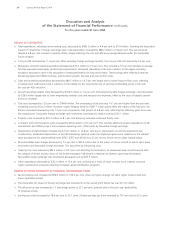
REVIEW OF FINANCIAL PERFORMANCE
Profit from ordinary activities before tax was $964.6 million, an increase of $462.3 million or 92.0 per cent. Net profit attributable
to members of the company was $648.4 million.
Earnings before interest and tax (EBIT) increased by $531.2 million or 93.7 per cent to $1,098.2 million.
Group International Flying Businesses contributed an EBIT of $398.9 million, an increase of $192.0 million versus the prior year. RPKs
increased by 5.7 per cent, marginally lower than the capacity (ASKs) increase of 5.8 per cent, leading to a 0.1 percentage point decrease
in seat factor. Yield, excluding the adverse movements in foreign exchange, remained consistent with the prior year. After the negative
impact of the SARS virus on the first four months of operations, capacity returned to the market from November 2003, coinciding with
the Rugby World Cup, which provided an additional boost. Capacity was progressively added in the second half including the
introduction of additional services to Los Angeles.
Group Domestic Flying Businesses contributed an EBIT of $539.3 million, an increase of $316.3 million versus the prior year. RPKs
increased by 4.4 per cent while capacity (ASKs) grew by 2.6 per cent, resulting in an increased seat factor of 1.3 percentage points.
Yield, excluding the adverse movements in foreign exchange rates, deteriorated by 3.8 per cent, as the market continued to absorb
increased capacity introduced by both Qantas and Virgin Blue. The new domestic fare structure implemented in July 2003, together
with the Rugby World Cup and the recovery in the international sector, contributed to the improved domestic result.
EBIT for non-flying subsidiary businesses improved by $22.9 million or 16.7 per cent due to improved performance by Qantas Holidays,
Qantas Flight Catering and Qantas Defence Services and an increase in the share of net profit of associates and joint ventures.
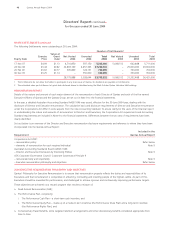
REVIEW OF SALES AND OPERATING REVENUE
Total revenue for the year decreased by $21.2 million to $11.4 billion, a decrease of 0.2 per cent versus the prior year. Excluding the
unfavourable impact of foreign exchange movements, revenue increased by $435.5 million or 3.8 per cent.
Net passenger revenue decreased by $14.5 million to $9.0 billion, a decrease of 0.2 per cent. Excluding the unfavourable impact of
exchange rate movements, revenue increased by 4.3 per cent due to growth in RPKs of 5.3 per cent, offset by a deterioration in yield
(excluding exchange) of 2.0 per cent. Overall Group capacity (ASKs) increased by 4.8 per cent compared with the prior year.
Non-passenger revenue decreased by $6.7 million to $2.4 billion, a decrease of 0.3 per cent. This was primarily due to decreased
freight and contract work revenue, partly offset by tours and travel revenue and ticket change fees.
Discussion and Analysis
of the Statement of Financial Performance
for the year ended 30 June 2004
Qantas Annual Report 2004 53Spirit of Australia