Qantas 2001 Annual Report Download - page 45
Download and view the complete annual report
Please find page 45 of the 2001 Qantas annual report below. You can navigate through the pages in the report by either clicking on the pages listed below, or by using the keyword search tool below to find specific information within the annual report.-
 1
1 -
2
-
3
-
4
-
5
-
6
-
7
-
8
-
9
-
10
-
11
-
12
-
13
-
14
-
15
-
16
-
17
-
18
-
19
-
20
-
21
-
22
-
23
-
24
-
25
-
26
-
27
-
28
-
29
-
30
-
31
-
32
-
33
-
34
-
 35
35 -
 36
36 -
 37
37 -
 38
38 -
 39
39 -
 40
40 -
 41
41 -
 42
42 -
 43
43 -
 44
44 -
 45
45 -
 46
46 -
 47
47 -
 48
48 -
 49
49 -
 50
50 -
 51
51 -
 52
52
 |
 |

THE SPIRIT OF AUSTRALIA p43
QANTAS GROUP
2001 2000
$M $M
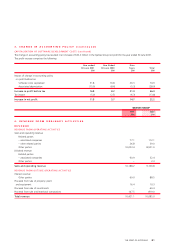
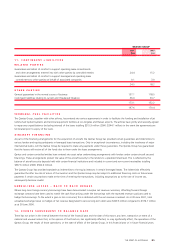
8. DIVIDENDS (continued)
Total franking account balance at 30.0 per cent (2000: 34.0 per cent) 241.4 174.2
The above amount represents the balance of the franking accounts as at 30 June 2001, after taking into account adjustments for:
(a) franking credits that will arise from the payment of income tax payable for the current financial year;
(b) franking debits that will arise from the payment of the final dividends for the current financial year; and
(c) franking credits that may be prevented from being distributed in subsequent years.
9. TOTAL EQUITY RECONCILIATION
Total equity at the beginning of the year 2,864.4 3,059.9
Total changes in equity recognised in the
Statement of Financial Performance 415.7 518.5
Contributions of equity 291.0 –
Dividends (264.2) (714.6)
Total changes in outside equity interest 9.0 0.6
Total equity at the end of the year 3,315.9 2,864.4
Contributed equity
1,308,612,512 (2000: 1,211,059,282) ordinary shares, fully paid 2,173.0 1,882.0
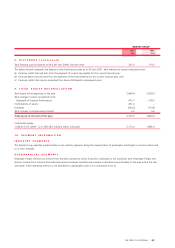
10. SEGMENT INFORMATION
INDUSTRY SEGMENTS
The Qantas Group operates predominantly in one industry segment, being the transportation of passengers and freight on services within and
to or from Australia.
GEOGRAPHICAL SEGMENTS
Passenger, freight and services revenue from domestic operations within Australia is attributed to the Australian area. Passenger, freight and
services revenue from inbound and outbound services between Australia and overseas is allocated proportionately to the area where the sale
was made. Other operating revenue is not allocated to a geographic area as it is impractical to do so.