Qantas 2001 Annual Report Download - page 29
Download and view the complete annual report
Please find page 29 of the 2001 Qantas annual report below. You can navigate through the pages in the report by either clicking on the pages listed below, or by using the keyword search tool below to find specific information within the annual report.-
 1
1 -
2
-
3
-
4
-
5
-
6
-
7
-
8
-
9
-
10
-
11
-
12
-
13
-
14
-
15
-
16
-
17
-
18
-
 19
19 -
 20
20 -
 21
21 -
 22
22 -
 23
23 -
 24
24 -
 25
25 -
 26
26 -
 27
27 -
 28
28 -
 29
29 -
 30
30 -
 31
31 -
 32
32 -
 33
33 -
 34
34 -
 35
35 -
 36
36 -
 37
37 -
 38
38 -
 39
39 -
40
-
41
-
42
-
43
-
44
-
45
-
46
-
47
-
48
-
49
-
50
-
51
-
52
 |
 |

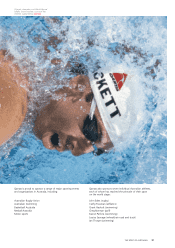
THE SPIRIT OF AUSTRALIA p27
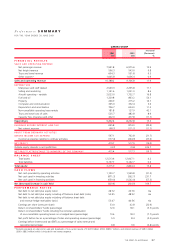
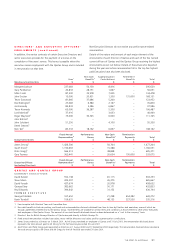
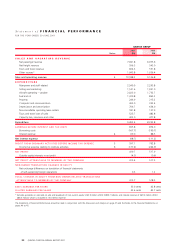
Performance SUMMARY
FOR THE YEAR ENDED 30 JUNE 2001
QANTAS GROUP
Increase/
2001 2000 (Decrease)
$M $M %
FINANCIAL RESULTS
SALES AND OPERATING REVENUE
Net passenger revenue 7,941.8 6,975.6 13.9
Net freight revenue 596.3 543.0 9.8
Tours and travel revenue 604.3 551.8 9.5
Other sources* 1,045.8 1,036.4 0.9
Sales and operating revenue 10,188.2 9,106.8 11.9
EXPENDITURE
Manpower and staff related 2,549.9 2,295.8 11.1
Selling and marketing 1,141.6 1,051.0 8.6
Aircraft operating – variable 2,023.0 1,732.7 16.8
Fuel and oil 1,329.8 863.2 54.1
Property 246.9 215.2 14.7
Computer and communication 365.0 352.4 3.6
Depreciation and amortisation 706.7 634.0 11.5
Non-cancellable operating lease rentals 181.8 127.9 42.1
Tours and travel cost of sales 525.7 482.8 8.9
Capacity hire, insurance and other 422.0 477.8 (11.7)
Expenditure 9,492.4 8,232.8 15.3
EARNINGS BEFORE INTEREST AND TAX 695.8 874.0 (20.4)
Net interest expense (98.7) (111.2) (11.2)
PROFIT FROM ORDINARY ACTIVITIES
BEFORE INCOME TAX EXPENSE 597.1 762.8 (21.7)
Income tax expense relating to ordinary activities (177.4) (244.9) (27.6)
NET PROFIT 419.7 517.9 (19.0)
Outside equity interests in net (profit)/loss (4.3) (0.6) 616.7
NET PROFIT ATTRIBUTABLE TO MEMBERS OF THE COMPANY 415.4 517.3 (19.7)
BALANCE SHEET
Total assets 12,513.6 12,007.1 4.2
Total liabilities 9,197.7 9,142.7 0.6
Total equity 3,315.9 2,864.4 15.8
CASH FLOWS
Net cash provided by operating activities 1,100.7 1,599.8 (31.2)
Net cash used in investing activities (871.3) (262.7) 231.7
Net cash used in financing activities (659.0) (1,542.0) (57.3)
Net (decrease)/increase in cash held (429.6) (204.9) 109.7
PERFORMANCE RATIOS
Net debt to net debt plus equity (ratio) 28:72 24:76 n/a
Net debt to net debt plus equity including off balance sheet debt (ratio) 55:45 48:52 n/a
Net debt to net debt plus equity including off balance sheet debt
and revenue hedge receivables (ratio) 53:47 44:56 n/a
Earnings per share (cents per share) 33.0 42.8 (22.9)
Return on shareholders’ funds (percentage) 12.6 18.1 (5.5) points
Return on shareholders’ funds including the notional capitalisation
of non-cancellable operating leases on a hedged basis (percentage) 10.6 18.3 (7.7) points
Net profit before tax as a percentage of sales and operating revenue (percentage) 5.9 8.4 (2.5) points
Earnings before interest and tax (EBIT) as a percentage of sales revenue and
operating (percentage) 6.8 9.6 (2.8) points
* Excludes proceeds on sale (and on sale and leaseback) of non-current assets of $163.9 million (2000: $889.7 million), and interest revenue of $69.0 million
(2000: $88.5 million) which is included in net interest expense.