Public Storage 2000 Annual Report Download - page 7
Download and view the complete annual report
Please find page 7 of the 2000 Public Storage annual report below. You can navigate through the pages in the report by either clicking on the pages listed below, or by using the keyword search tool below to find specific information within the annual report.-
 1
1 -
 2
2 -
 3
3 -
 4
4 -
 5
5 -
 6
6 -
 7
7 -
 8
8 -
 9
9 -
 10
10 -
 11
11 -
 12
12 -
 13
13 -
 14
14 -
 15
15 -
 16
16 -
 17
17 -
 18
18 -
19
-
20
-
21
-
22
-
23
-
24
-
25
-
26
-
27
-
28
-
29
-
30
-
31
-
32
-
33
-
34
-
35
-
36
-
37
-
38
-
39
-
40
-
41
-
42
-
43
-
44
-
45
-
46
-
47
-
48
-
49
-
50
-
51
-
52
 |
 |

5
P
UBLIC
S
TORAGE
, I
NC
. 2000 A
NNUAL
R
EPORT
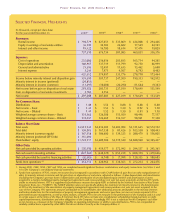
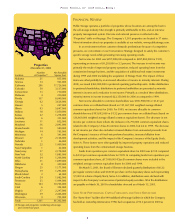
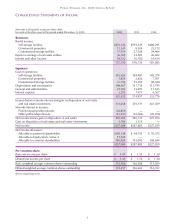
compared to 92.5 percent in 1999. Same
Store average annual realized rents were
$10.36 per square foot for 2000, compared
to $9.89 for 1999. Realized rent per occupied
square foot represents the actual revenue
earned per occupied square foot. We believe
this is a more relevant measure than posted
or scheduled rates, since posted rates can be
discounted through promotions. Same Store
rental income advanced to $547,904,000
for 2000, versus $524,880,000 for 1999.
Same Store cost of operations increased to
$164,197,000 for 2000, compared to
$154,974,000 for 1999. Net operating income
was $383,707,000 for 2000, compared to
$369,906,000 for 1999.
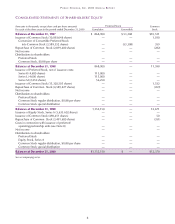
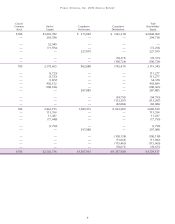
In December 2000, the Company
issued publicly 1,282,500 depositary shares,
each representing 1/1,000 of a share of the
Company’s Equity Stock, Series A, raising net
proceeds of $28,518,000. In January 2001,
the Company completed a public offering
of 6,900,000 depositary shares ($25 stated
value per depositary share) each representing
1/1,000 of a share of 8.6% Cumulative
Preferred Stock, Series Q, raising net
proceeds of approximately $167,066,000.
The Board of Directors has authorized
the repurchase from time to time of up
to 20,000,000 shares of the Company’s
common stock on the open market or in
privately negotiated transactions. In 2000,
the Company repurchased a total of
3,491,600 shares at an aggregate cost of
approximately $77,799,000. Cumulatively
since the repurchase announcement,
through December 31, 2000, the Company
repurchased a total of 10,900,427 shares
of common stock at an aggregate cost of
approximately $258,620,000. From January
1, 2001 through March 14, 2001, the
Company repurchased 3,961,800 shares
at an aggregate cost of approximately
$102,200,000.
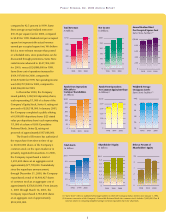
Net Income
In Millions
(1) “Same Store” refers to stabilized self-storage facilities in which the Company had an interest since January 1, 1994.
(2) Assumes conversion of the Company’s Convertible Preferred Stock into common stock. Includes 7,000,000 Class B
common shares in computing weighted average common equivalent shares for all periods.
0
100
150
200
$300
50
250
1998 1999 2000
Total Revenues
In Millions
0
150
300
450
600
$750
1998 1999 2000
Weighted Average
Occupancy Levels
Same Store Facilities
(1)
84
86
88
90
92
94%
1998 1999 2000
92.5% 92.5% 92.3%
Funds From Operations
Per Common Equivalent Share
In Millions
(2)
0
1.00
1.50
2.00
2.50
$3.00
.50
1998 1999 2000
$2.50
$2.11
$2.59
Funds From Operations
Allocable to
Common Shareholders
In Millions
0
50
200
300
$350
100
150
250
1998 1999 2000
Annual Realized Rent
Per Occupied Square Foot
Same Store Facilities
(1)
0
2.00
4.00
6.00
8.00
$10.00
1998 1999 2000
$10.36
$9.89
$9.46
Shareholders’ Equity
In Billions
0
1.0
1.5
2.0
2.5
3.5
$4.0
0.5
3.0
1998 1999 2000
Total Assets
In Billions
0
1.0
2.0
$5.0
3.0
4.0
1998 1999 2000
Debt as Percent of
Shareholders’ Equity
0
1
2
3
4
5%
1998 1999 2000
2.6%
4.5%
4.2%