Public Storage 2000 Annual Report Download - page 12
Download and view the complete annual report
Please find page 12 of the 2000 Public Storage annual report below. You can navigate through the pages in the report by either clicking on the pages listed below, or by using the keyword search tool below to find specific information within the annual report.-
 1
1 -
 2
2 -
 3
3 -
 4
4 -
 5
5 -
 6
6 -
 7
7 -
 8
8 -
 9
9 -
 10
10 -
 11
11 -
 12
12 -
 13
13 -
 14
14 -
 15
15 -
 16
16 -
 17
17 -
 18
18 -
 19
19 -
 20
20 -
 21
21 -
 22
22 -
23
-
24
-
25
-
26
-
27
-
28
-
29
-
30
-
31
-
32
-
33
-
34
-
35
-
36
-
37
-
38
-
39
-
40
-
41
-
42
-
43
-
44
-
45
-
46
-
47
-
48
-
49
-
50
-
51
-
52
 |
 |

P
UBLIC
S
TORAGE
, I
NC
. 2000 A
NNUAL
R
EPORT
10
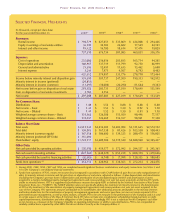
(Amounts in thousands)
For each of the three years in the period ended December 31, 2000 2000 1999 1998
Cash flows from operating activities:
Net income
$ 297,088
$ 287,885 $ 227,019
Adjustments to reconcile net income to net cash
provided by operating activities:
Less gain on disposition of real estate and real estate investments
(3,786)
(2,154) —
Depreciation and amortization
148,967
137,719 111,799
Depreciation included in equity in earnings of real estate entities
21,825
19,721 13,884
Minority interest in income
38,356
16,006 20,290
Total adjustments
205,362
171,292 145,973
Net cash provided by operating activities
502,450
459,177 372,992
Cash flows from investing activities:
Principal payments received on mortgage notes receivable
7,650
28,837 46,897
Acquisition of minority interests
(31,271)
(36,846) (22,845)
Notes receivable from affiliates
(11,400)
(30,594) (33,000)
Acquisition of real estate facilities
(62,938)
(26,640) (46,064)
Acquisition cost of business combinations
(66,776)
(180,216) (85,883)
Reduction in cash due to the deconsolidation of
PS Business Parks, Inc. (See Note 2)
—
—(11,260)
Investment in containerized storage business
—
—(2,571)
Investments in real estate entities
(75,146)
(77,656) (99,934)
Construction in process
(232,918)
(109,047) (79,132)
Capital improvements to real estate facilities
(33,023)
(29,023) (31,714)
Proceeds from the sale of real estate facilities and real estate investments
58,319
12,656 10,275
Net cash used in investing activities
(447,503)
(448,529) (355,231)
Cash flows from financing activities:
Net paydown on revolving line of credit
—
—(7,000)
Net proceeds from the issuance of preferred stock
—
276,932 —
Net proceeds from the issuance of preferred partnership units
361,250
——
Net proceeds from the issuance of Equity Stock, Series A
68,318
——
Net proceeds from the issuance of common stock
4,608
10,000 237,860
Repurchase of the Company’s common stock
(77,799)
(108,565) (72,256)
Principal payments on mortgage notes payable
(11,335)
(14,088) (15,131)
Distributions paid to shareholders
(343,388)
(208,090) (179,101)
Distributions paid to minority interests
(45,494)
(25,300) (32,312)
Investment by minority interests
17,871
61,928 54,809
Other
5,364
435 5,140
Net cash used in financing activities
(20,605)
(6,748) (7,991)
Net increase in cash and cash equivalents
34,342
3,900 9,770
Cash and cash equivalents at the beginning of the year
55,125
51,225 41,455
Cash and cash equivalents at the end of the year
$ 89,467
$ 55,125 $ 51,225
See accompanying notes.
C
ONSOLIDATED
S
TATEMENTS OF
C
ASH
F
LOWS