Public Storage 2000 Annual Report Download - page 18
Download and view the complete annual report
Please find page 18 of the 2000 Public Storage annual report below. You can navigate through the pages in the report by either clicking on the pages listed below, or by using the keyword search tool below to find specific information within the annual report.-
 1
1 -
2
-
3
-
4
-
5
-
6
-
7
-
 8
8 -
 9
9 -
 10
10 -
 11
11 -
 12
12 -
 13
13 -
 14
14 -
 15
15 -
 16
16 -
 17
17 -
 18
18 -
 19
19 -
 20
20 -
 21
21 -
 22
22 -
 23
23 -
 24
24 -
 25
25 -
 26
26 -
 27
27 -
 28
28 -
29
-
30
-
31
-
32
-
33
-
34
-
35
-
36
-
37
-
38
-
39
-
40
-
41
-
42
-
43
-
44
-
45
-
46
-
47
-
48
-
49
-
50
-
51
-
52
 |
 |

P
UBLIC
S
TORAGE
, I
NC
. 2000 A
NNUAL
R
EPORT
16
The historical operating results of the above acquisitions prior to each respective acquisition date have not been included in the
Company’s historical operating results. Pro forma data (unaudited) for the two years ended December 31, 2000 as though the business
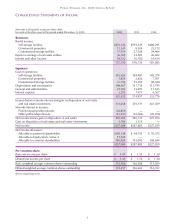
combinations above had been effective at the beginning of fiscal 1999 are as follows: For the Year
Ended December 31,
(In thousands except per share data) 2000 1999
Revenues $764,237 $710,727
Net income $295,147 $288,592
Net income per common share (Basic) $ 1.40 $ 1.50
Net income per common share (Diluted) $ 1.40 $ 1.50
The pro forma data does not purport to be indicative either of results of operations that would have occurred had the transactions
occurred at the beginning of fiscal 1999 or future results of operations of the Company. Certain pro forma adjustments were made
to the combined historical amounts to reflect (i) expected reductions in general and administrative expenses, (ii) estimated increased
interest expense from bank borrowings to finance the cash portion of the acquisition cost and (iii) estimated increase in depreciation
and amortization expense.
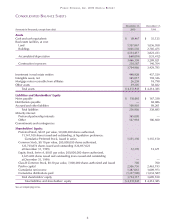
Note 4 —
Real Estate Facilities
Activity in real estate facilities during 2000, 1999 and 1998 is as follows:
(Amounts in thousands) 2000 1999 1998
Operating facilities, at cost:
Beginning balance $3,822,433 $2,962,291 $3,077,529
Property acquisitions:
Business combinations (Note 3) 82,163 727,925 224,999
Other acquisitions 67,107 36,013 64,818
Disposition of facilities (20,516) (26,021) —
Facilities contributed to unconsolidated real estate entities —(15,415) —
Newly developed facilities opened for operations 135,095 62,870 38,629
Acquisition of minority interest (Note 8) 15,112 45,747 23,293
Capital improvements 33,023 29,023 31,714
PSB deconsolidation (see below) ——(498,691)
Ending balance 4,134,417 3,822,433 2,962,291
Accumulated depreciation:
Beginning balance (533,412) (411,176) (378,248)
Additions during the year (134,857) (123,495) (98,173)
Disposition of facilities 251 1,259 —
PSB deconsolidation (see below) ——65,245
Ending balance (668,018) (533,412) (411,176)
Construction in process:
Beginning balance 140,764 83,138 42,635
Current development 232,918 109,047 79,132
Property acquisitions – merger with Storage Trust —11,449 —
Newly developed facilities opened for operations (135,095) (62,870) (38,629)
Ending balance 238,587 140,764 83,138
Total real estate facilities $3,704,986 $3,429,785 $2,634,253