Pentax 2012 Annual Report Download - page 74
Download and view the complete annual report
Please find page 74 of the 2012 Pentax annual report below. You can navigate through the pages in the report by either clicking on the pages listed below, or by using the keyword search tool below to find specific information within the annual report.-
 1
1 -
2
-
3
-
4
-
5
-
6
-
7
-
8
-
9
-
10
-
11
-
12
-
13
-
14
-
15
-
16
-
17
-
18
-
19
-
20
-
21
-
22
-
23
-
24
-
25
-
26
-
27
-
28
-
29
-
30
-
31
-
32
-
33
-
34
-
35
-
36
-
37
-
38
-
39
-
40
-
41
-
42
-
43
-
44
-
45
-
46
-
47
-
48
-
49
-
50
-
51
-
52
-
53
-
54
-
55
-
56
-
57
-
58
-
59
-
60
-
61
-
62
-
63
-
 64
64 -
 65
65 -
 66
66 -
 67
67 -
 68
68 -
 69
69 -
 70
70 -
 71
71 -
 72
72 -
 73
73 -
 74
74 -
 75
75 -
 76
76
 |
 |
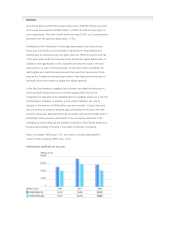
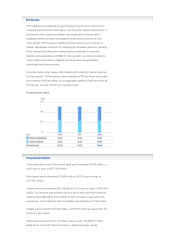
Depreciation for the fiscal year under review decreased 10.8%, to ¥27,927
million. The Information Technology accounted for approximately 60% of this,
at ¥17,983 million.
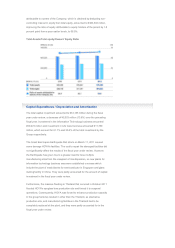
Net cash provided by operating activities amounted to ¥73,719 million, a
decrease of ¥18,795 million from the previous fiscal year. The main positive
factors were profit before taxes from continuing operations of ¥54,021 million
(down ¥9,224 million year on year), depreciation and amortization of ¥27,927
million (down ¥3,367 million), and trade and other receivables of ¥10,791 (up
¥8,120 million). The main negative factors included an increase in inventories
of ¥4,800 million (down ¥5,326 million) and trade and other payables of
¥6,728 million (up ¥13,735 million).
Net cash used in investing activities amounted to ¥22,497 million, a decrease
of ¥15,994 million compared with the previous fiscal year. This was primarily
attributable to ¥16,618 million in withdrawals of time deposit (up ¥15,070
million), withdrawals of transferable deposit of ¥10,000 million, proceeds from
business transfer of ¥12,537 million (down ¥8,117 million), deposits for
transferable deposit of ¥30,000 million, and payments for acquisition of
property, plant and equipment of ¥31,184 million (down ¥4,857 million).
Net cash used in financing activities amounted to ¥29,259 million, a decrease
of ¥1,985 million. This was mainly due to a total of ¥28,003 million in
dividends paid (up ¥32 million year on year).
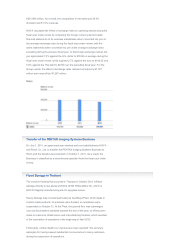
As a result of the above, the balance of cash and cash equivalents as of
March 31, 2012, was ¥204,772 million, a year on year increase of ¥19,520
million.
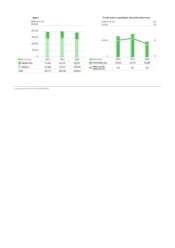
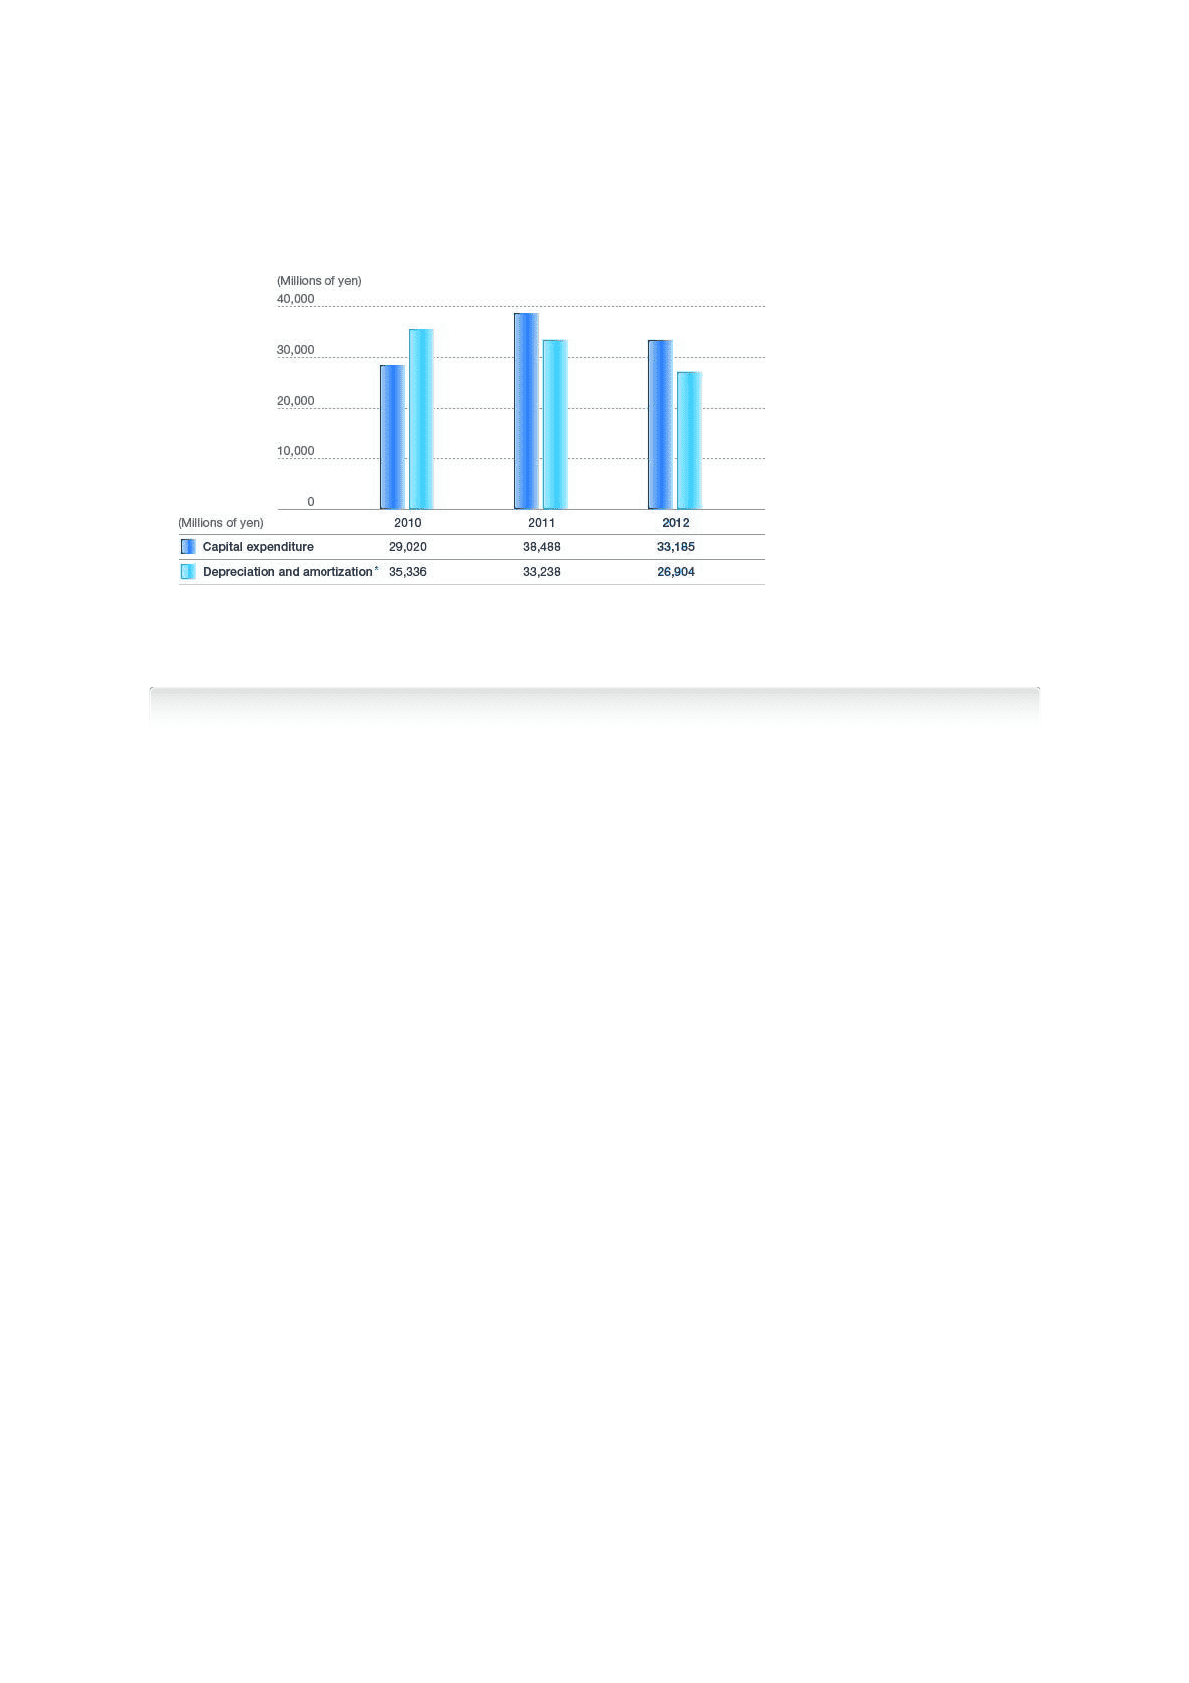
Capital Expenditure/Depreciation and Amortization
* Depreciation and amortization includes also impairment losses.
Cash Flow