Pentax 2012 Annual Report Download - page 72
Download and view the complete annual report
Please find page 72 of the 2012 Pentax annual report below. You can navigate through the pages in the report by either clicking on the pages listed below, or by using the keyword search tool below to find specific information within the annual report.-
 1
1 -
2
-
3
-
4
-
5
-
6
-
7
-
8
-
9
-
10
-
11
-
12
-
13
-
14
-
15
-
16
-
17
-
18
-
19
-
20
-
21
-
22
-
23
-
24
-
25
-
26
-
27
-
28
-
29
-
30
-
31
-
32
-
33
-
34
-
35
-
36
-
37
-
38
-
39
-
40
-
41
-
42
-
43
-
44
-
45
-
46
-
47
-
48
-
49
-
50
-
51
-
52
-
53
-
54
-
55
-
56
-
57
-
58
-
59
-
60
-
61
-
 62
62 -
 63
63 -
 64
64 -
 65
65 -
 66
66 -
 67
67 -
 68
68 -
 69
69 -
 70
70 -
 71
71 -
 72
72 -
 73
73 -
 74
74 -
 75
75 -
 76
76
 |
 |

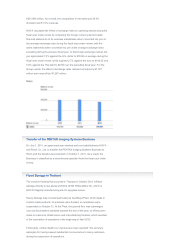
HOYA determines dividends for each fiscal year by taking into account the
Company's performance and medium- and long-term capital requirements. It
also tries to strike a balance between returning profits to shareholders,
employee welfare benefits, and supplementing internal reserves to fund
future growth. HOYA's policy regarding internal reserves is to continue to
actively appropriate resources for marketing for consumer products, primarily
in the medical field, while also making timely investments in corporate
mergers and acquisitions and R&D for future growth, as well as investing to
ensure sufficient production capacity and to develop next-generation
technologies and new products.
In the fiscal year under review, after balancing the need for internal reserves
for future growth, HOYA paid an interim dividend of ¥30 per share and a year-
end dividend of ¥35 per share, for an aggregate dividend of ¥65 per share for
the full year, on a par with the previous fiscal year.
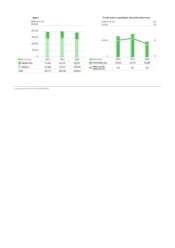
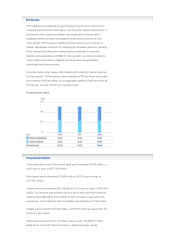
Total assets at the end of the current fiscal year decreased ¥3,406 million, or
0.6% year on year, to ¥575,235 million.
Non-current assets decreased ¥32,624 million (16.0%) year on year, to
¥171,561 million.
Current assets increased by ¥29,218 million (7.8%) year on year, to ¥403,674
million. The increase was primarily due to a rise in other short-term financial
assets by ¥20,308 million and a ¥19,521 million increase in cash and cash
equivalents, while trade and other receivables decreased by ¥10,763 million.
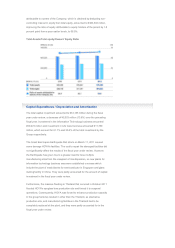
Liabilities amounted to ¥190,582 million, a ¥10,518 million decrease from the
levels of a year earlier.
Total equity increased by ¥7,112 million year on year, to ¥384,653 million,
partly due to a ¥15,177 million increase in retained earnings. Equity
Dividends
Dividends per share
Financial Position