Panasonic 2010 Annual Report Download - page 4
Download and view the complete annual report
Please find page 4 of the 2010 Panasonic annual report below. You can navigate through the pages in the report by either clicking on the pages listed below, or by using the keyword search tool below to find specific information within the annual report.-
 1
1 -
 2
2 -
 3
3 -
 4
4 -
 5
5 -
 6
6 -
 7
7 -
 8
8 -
 9
9 -
 10
10 -
 11
11 -
 12
12 -
 13
13 -
 14
14 -
 15
15 -
16
-
17
-
18
-
19
-
20
-
21
-
22
-
23
-
24
-
25
-
26
-
27
-
28
-
29
-
30
-
31
-
32
-
33
-
34
-
35
-
36
-
37
-
38
-
39
-
40
-
41
-
42
-
43
-
44
-
45
-
46
-
47
-
48
-
49
-
50
-
51
-
52
-
53
-
54
-
55
-
56
-
57
-
58
-
59
-
60
-
61
-
62
-
63
-
64
-
65
-
66
-
67
-
68
-
69
-
70
-
71
-
72
 |
 |

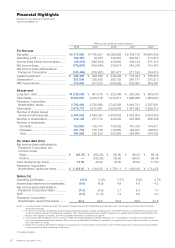
Millions of yen, except per share information
2010 2009 2008 2007 2006
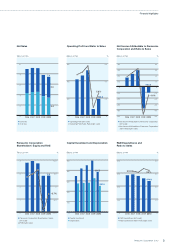
For the year
Net sales ............................................. ¥7,417,980 ¥7,765,507 ¥9,068,928 ¥9,108,170 ¥8,894,329
Operating profit ................................... 190,453 72,873 519,481 459,541 414,273
Income (loss) before income taxes ....... (29,315) (382,634) 434,993 439,144 371,312
Net income (loss) ................................. (170,667) (403,843) 310,514 248,316 153,423
Net income (loss) attributable to
Panasonic Corporation ...................... (103,465) (378,961) 281,877 217,185 154,410
Capital investment* .............................. ¥ 385,489 ¥ 494,368 ¥ 449,348 ¥ 418,334 ¥ 345,819
Depreciation* ....................................... 251,839 325,835 282,102 280,177 275,213
R&D expenditures ................................ 476,903 517,913 554,538 578,087 564,781
At year-end
Long-term debt ................................... ¥1,028,928 ¥ 651,310 ¥ 232,346 ¥ 226,780 ¥ 264,070
Total assets ......................................... 8,358,057 6,403,316 7,443,614 7,896,958 7,964,640
Panasonic Corporation
shareholders’ equity ........................... 2,792,488 2,783,980 3,742,329 3,916,741 3,787,621
Total equity .......................................... 3,679,773 3,212,581 4,256,949 4,467,895 4,289,212
Number of shares issued
at year-end (thousands) ..................... 2,453,053 2,453,053 2,453,053 2,453,053 2,453,053
Number of shareholders ...................... 316,182 277,710 234,532 250,858 252,239
Number of employees:
Domestic ......................................... 152,853 132,144 135,563 145,418 144,871
Overseas ......................................... 231,733 160,106 170,265 183,227 189,531
Total ................................................. 384,586 292,250 305,828 328,645 334,402
Per share data (Yen)
Net income (loss) attributable to
Panasonic Corporation per
common share
Basic ............................................... ¥ (49.97) ¥ (182.25) ¥ 132.90 ¥ 99.50 ¥ 69.48
Diluted ............................................. —(182.25) 132.90 99.50 69.48
Cash dividends per share .................... 12.50 40.00 32.50 25.00 17.50
Panasonic Corporation
shareholders’ equity per share ........... ¥ 1,348.63 ¥ 1,344.50 ¥ 1,781.11 ¥ 1,824.89 ¥ 1,714.22
Ratios (%)
Operating profit/sales .......................... 2.6% 0.9 % 5.7% 5.0% 4.7%
Income (loss) before income taxes/sales.. (0.4) (4.9) 4.8 4.8 4.2
Net income (loss) attributable to
Panasonic Corporation/sales ............. (1.4) (4.9) 3.1 2.4 1.7
ROE .................................................... (3.7) (11.8) 7.4 5.6 4.2
Panasonic Corporation
shareholders’ equity/total assets ........ 33.4 43.5 50.3 49.6 47.6
Notes: 1. In computing cash dividends per share, the number of shares at the end of the applicable period has been used. Cash dividends per share reflect those paid
during each fiscal year.
2. In order to be consistent with generally accepted financial reporting practices in Japan, operating profit, a non-GAAP measure, is presented as net sales less cost
of sales and selling, general and administrative expenses. The Company believes that this is useful to investors in comparing the Company’s financial results with
those of other Japanese companies. See the consolidated statements of operations on page 64.
3. In accordance with the adoption of the provisions of FASB Accounting Standards Codification (ASC) No. 810, “Consolidation,” information for fiscal 2009 and
prior years has been reclassified and restated. (“Net income (loss) attributable to Panasonic Corporation” is computed the same as “Net income (loss)” up until the
year ended March 31, 2009.)
4. Diluted net income (loss) attributable to Panasonic Corporation per common share for fiscal 2010 has been omitted because the Company did not have potential
common shares that were outstanding for the period.
* Excluding intangibles
2Panasonic Corporation 2010
Financial Highlights
Panasonic Corporation and Subsidiaries
Years ended March 31