Office Depot 2007 Annual Report Download - page 30
Download and view the complete annual report
Please find page 30 of the 2007 Office Depot annual report below. You can navigate through the pages in the report by either clicking on the pages listed below, or by using the keyword search tool below to find specific information within the annual report.-
 1
1 -
2
-
3
-
4
-
5
-
6
-
7
-
8
-
9
-
10
-
11
-
12
-
13
-
14
-
15
-
16
-
17
-
18
-
19
-
 20
20 -
 21
21 -
 22
22 -
 23
23 -
 24
24 -
 25
25 -
 26
26 -
 27
27 -
 28
28 -
 29
29 -
 30
30 -
 31
31 -
 32
32 -
 33
33 -
 34
34 -
 35
35 -
 36
36 -
 37
37 -
 38
38 -
 39
39 -
 40
40 -
41
-
42
-
43
-
44
-
45
-
46
-
47
-
48
-
49
-
50
-
51
-
52
-
53
-
54
-
55
-
56
-
57
-
58
-
59
-
60
-
61
-
62
-
63
-
64
-
65
-
66
-
67
-
68
-
69
-
70
-
71
-
72
-
73
-
74
-
75
-
76
-
77
-
78
-
79
-
80
-
81
-
82
-
83
-
84
-
85
-
86
-
87
-
88
 |
 |

28
Gain on Sale of Building
In December 2006, in connection with a decision to move to a new, leased, global headquarters near our current
headquarters facility, we sold our corporate campus and entered into a leaseback agreement until construction of our
new facility is complete. The sale resulted in a gain of approximately $21 million recognized in 2006 and $15
million deferred over the leaseback period. During 2007, we recognized approximately $7 million in amortization of
the deferred gain on the sale. This amortization largely offsets the rent expense during the leaseback period. We
have also entered into a longer-term lease on the new facility that is expected to be available for occupancy at or
about the end of 2008. For additional information on the lease of the new facility, see the “Contractual Obligations”
subsection of Management’s Discussion and Analysis of Financial Condition and Results of Operation.
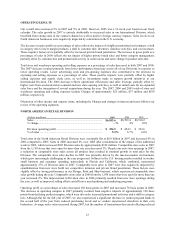
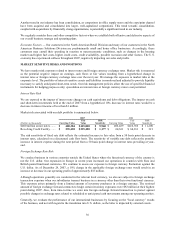
Other Income and Expense
(Dollars in millions) 2007 2006 2005
Interest income............................................................................................... $ 9.4 $ 9.8 $ 22.2
Interest expense.............................................................................................. (63.1) (40.8) (32.4)
Loss on extinguishment of debt...................................................................... — (5.7) —
Miscellaneous income, net ............................................................................. 28.7 30.6 23.6
Interest income remained relatively flat in 2007, compared to 2006. The change in 2006 compared to 2005 reflects
lower average cash balances, partially offset by higher interest rates.
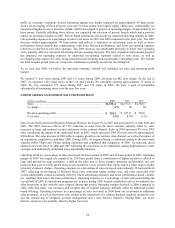
Interest expense increased for 2007 compared to 2006, reflecting a higher level of short-term borrowings. Our debt,
including short- and long-term borrowings, net of cash and investments, at the end of 2007 was $593 million,
compared to $445 million at the end of 2006. Average net debt outstanding during 2007 was approximately $553
million compared to $250 million during 2006, and this average may fluctuate in future periods with changes in
working capital needs. Additionally, 2007 interest expense includes approximately $3.5 million of incremental
expense recorded in connection with reconciliations of amounts due under certain borrowings that are not expected
to recur. The increase in interest expense in 2006 compared to 2005 primarily results from the 2005 reduction of
interest requirements following the favorable settlement of various tax claims.
The loss on extinguishment of debt in 2006 represents the $5.7 million make whole payment related to settlement of
the mortgage on our corporate campus that was sold during the year.
Our net miscellaneous income consists of our earnings of joint venture investments, royalty and franchise income,
gains and losses related to foreign exchange transactions, and realized gains and impairments of other investments,
if any. The majority of miscellaneous income is attributable to equity in earnings from our joint venture in Mexico,
Office Depot de Mexico. The change in 2007 reflects higher joint venture earnings offset by foreign currency losses.
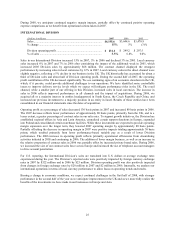
Income Taxes
(Dollars in millions) 2007 2006 2005
Income Taxes .............................................................................................. $ 63.0 $ 203.6 $ 87.7
Effective income tax rate*........................................................................... 14% 29% 24%
____________
* Income Taxes as a percentage of earnings before income taxes.
The effective income tax rate decreased 15 percentage points in 2007 compared to 2006, primarily reflecting the
impact from 2007 discrete benefits and current year valuation allowance changes, as well as the impact from a shift
in the mix of pretax income, reflecting a higher proportion of international earnings taxed at lower rates. Our
operational tax rates before discrete items and an international law change in the fourth quarter this year was
approximately 25% in 2007 and 30% in 2006. The 2007 discrete items include a benefit of approximately $10
million from the reversal of an accrual for uncertain tax position following a previously-disclosed restructuring
initiative and a local jurisdiction ruling that secured certain prior year filing positions. Additionally, we implemented
a separate jurisdictional restructuring that will change the amount of income recognized in those jurisdictions,
resulting in the future realization of existing net operating loss carryforwards. As a result, during the third quarter of
2007, we eliminated the related valuation allowance of approximately $19 million on deferred tax assets, as well as