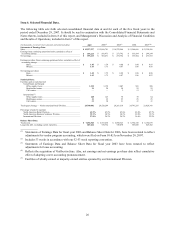
Office Depot 2007 Annual Report Download - page 24
Download and view the complete annual report
Please find page 24 of the 2007 Office Depot annual report below. You can navigate through the pages in the report by either clicking on the pages listed below, or by using the keyword search tool below to find specific information within the annual report.-
 1
1 -
2
-
3
-
4
-
5
-
6
-
7
-
8
-
9
-
10
-
11
-
12
-
13
-
 14
14 -
 15
15 -
 16
16 -
 17
17 -
 18
18 -
 19
19 -
 20
20 -
 21
21 -
 22
22 -
 23
23 -
 24
24 -
 25
25 -
 26
26 -
 27
27 -
 28
28 -
 29
29 -
 30
30 -
 31
31 -
 32
32 -
 33
33 -
 34
34 -
35
-
36
-
37
-
38
-
39
-
40
-
41
-
42
-
43
-
44
-
45
-
46
-
47
-
48
-
49
-
50
-
51
-
52
-
53
-
54
-
55
-
56
-
57
-
58
-
59
-
60
-
61
-
62
-
63
-
64
-
65
-
66
-
67
-
68
-
69
-
70
-
71
-
72
-
73
-
74
-
75
-
76
-
77
-
78
-
79
-
80
-
81
-
82
-
83
-
84
-
85
-
86
-
87
-
88
 |
 |
22
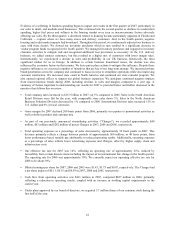
Evidence of a softening in business spending began to impact our results in the first quarter of 2007, particularly in
our sales to small- and medium-sized businesses. This continued into the second quarter as declines in construction
spending, higher fuel prices and softness in the housing market were seen as macroeconomic factors adversely
affecting our sales. By the third quarter, a downturn related to housing became particularly apparent in Florida and
California — regions where we have many stores and delivery customers. And, in the fourth quarter, negative
housing and credit market impacts had broadened. Throughout this period, we continuously adjusted our business to
cope with these factors. We slowed our inventory purchases which in turn resulted in a significant decrease in
vendor program funds recognized in the fourth quarter. We managed inventory purchases and engaged in inventory
clearance activities to mitigate risk and recognized additional loss provisions as necessary. In the U.S. delivery
business, we added contract customers, but this resulted in a higher mix of customers with lower margin sales.
Internationally, we experienced a decline in sales and profitability in our UK business, historically, the most
significant market for us in Europe. In addition to certain business transitional issues, the decline was also
influenced by economic factors in that country. We have put in place actions to mitigate this influence. Despite these
negative influences, we executed a number of initiatives that are key to our long-term strategy. We increased private
brand penetration across the company and continued to focus on ways to streamline operations while also improving
customer satisfaction. We increased store count in North America and continued our store remodel program. We
also opened regional offices to support our global business expansion. We anticipate continued negative impacts
from macroeconomic trends during 2008, including declines in sales and margins compared to a year ago. A
summary of factors important to understanding our results for 2007 is provided below and further discussed in the
narrative that follows this overview.
•Total company sales increased to $15.5 billion in 2007, up 3% compared to 2006. Sales in the North American
Retail Division were flat for the year, with comparable store sales down 5%. Sales in the North American
Business Solutions Division decreased by 1% compared to 2006. International Division sales increased 15% in
U.S. dollars and 6% in local currencies.
•Gross margin for 2007 declined 200 basis points from 2006, primarily in response to promotional activities as
well as shifts in product and customer mix.
•As part of our previously announced streamlining activities (“Charges”), we recorded approximately $40
million, $63 million and $282 million of pretax Charges in 2007, 2006 and 2005, respectively.
•Total operating expenses as a percentage of sales decreased by approximately 30 basis points in 2007. This
decrease primarily reflects a change between periods of approximately $60 million, or 40 basis points, from
lower performance-based variable pay attributable to reduced operating results. Additionally, operating expenses
as a percentage of sales reflects lower advertising expenses and Charges, offset by higher supply chain and
infrastructure costs.
•Our effective tax rate for 2007 was 14%, reflecting an operating rate of approximately 25%, reduced by
favorability from certain discrete items including the impact of an international law change in the fourth quarter.
The operating rate for 2006 was approximately 30%. We currently expect our operating effective tax rate for
2008 to be about 30%.
•Diluted earnings per share for 2007, 2006 and 2005 were $1.43, $1.75 and $0.87, respectively. The Charges had
a per share impact of $0.11, $0.15 and $0.59 in 2007, 2006 and 2005, respectively.
•Cash flow from operating activities was $411 million in 2007, compared $827 million in 2006, primarily
reflecting a reduction in operating results, coupled with an increase in working capital requirements in the
current year.
•Under plans approved by our board of directors, we acquired 5.7 million shares of our common stock during the
first half of the year.