O'Reilly Auto Parts 2011 Annual Report Download - page 6
Download and view the complete annual report
Please find page 6 of the 2011 O'Reilly Auto Parts annual report below. You can navigate through the pages in the report by either clicking on the pages listed below, or by using the keyword search tool below to find specific information within the annual report.-
 1
1 -
 2
2 -
 3
3 -
 4
4 -
 5
5 -
 6
6 -
 7
7 -
 8
8 -
 9
9 -
 10
10 -
 11
11 -
 12
12 -
 13
13 -
 14
14 -
 15
15 -
 16
16 -
 17
17 -
18
-
19
-
20
-
21
-
22
-
23
-
24
-
25
-
26
-
27
-
28
-
29
-
30
-
31
-
32
-
33
-
34
-
35
-
36
-
37
-
38
-
39
-
40
-
41
-
42
-
43
-
44
-
45
-
46
-
47
-
48
-
49
-
50
-
51
-
52
-
53
-
54
-
55
-
56
-
57
-
58
-
59
-
60
-
61
-
62
-
63
-
64
-
65
-
66
-
67
-
68
-
69
-
70
-
71
-
72
-
73
-
74
-
75
-
76
-
77
-
78
-
79
-
80
-
81
-
82
-
83
-
84
-
85
-
86
-
87
-
88
-
89
-
90
-
91
-
92
-
93
-
94
-
95
-
96
-
97
-
98
-
99
-
100
 |
 |

13
11
11
12
125
84
62
66
78
71
71
61
23
16
94
89
99
87
112
128
106
101
120
112
138
161
474
563
141
44
30
44
55
39
30
46
181
141
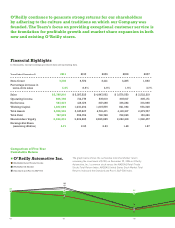
Store and Revenue Growth
(in millions)
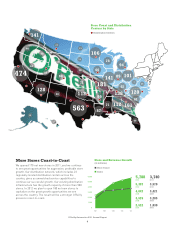
More Stores Coast-to-Coast
We opened 170 net new stores in 2011, and we continue
to see great opportunities for aggressive, profitable store
growth. Our distribution network, which includes 23
regionally located distribution centers across the
country, gives us unmatched service capabilities to
continue our successful growth. Our existing distribution
infrastructure has the growth capacity of more than 500
stores. In 2012 we plan to open 180 net new stores to
capitalize on the great growth opportunities we see
across the country. The result will be a stronger O’Reilly
presence coast-to-coast.
Store Count
Sales
Store Count and Distribution
Centers by State
Distribution Centers
O’Reilly Automotive 2011 Annual Report
4
‘07 ‘08 ‘09 ‘10 ‘11
5,788
2011
5,397
2010
4,847
2009
3,576
2008
2,522
2007
3,740
2011
3,570
2010
3,421
2009
3,285
2008
1,830
2007
6,000
5,000
4,000
3,000
2,000
1,000
0