O'Reilly Auto Parts 2011 Annual Report Download - page 2
Download and view the complete annual report
Please find page 2 of the 2011 O'Reilly Auto Parts annual report below. You can navigate through the pages in the report by either clicking on the pages listed below, or by using the keyword search tool below to find specific information within the annual report.-
 1
1 -
 2
2 -
 3
3 -
 4
4 -
 5
5 -
 6
6 -
 7
7 -
 8
8 -
 9
9 -
 10
10 -
 11
11 -
 12
12 -
 13
13 -
14
-
15
-
16
-
17
-
18
-
19
-
20
-
21
-
22
-
23
-
24
-
25
-
26
-
27
-
28
-
29
-
30
-
31
-
32
-
33
-
34
-
35
-
36
-
37
-
38
-
39
-
40
-
41
-
42
-
43
-
44
-
45
-
46
-
47
-
48
-
49
-
50
-
51
-
52
-
53
-
54
-
55
-
56
-
57
-
58
-
59
-
60
-
61
-
62
-
63
-
64
-
65
-
66
-
67
-
68
-
69
-
70
-
71
-
72
-
73
-
74
-
75
-
76
-
77
-
78
-
79
-
80
-
81
-
82
-
83
-
84
-
85
-
86
-
87
-
88
-
89
-
90
-
91
-
92
-
93
-
94
-
95
-
96
-
97
-
98
-
99
-
100
 |
 |

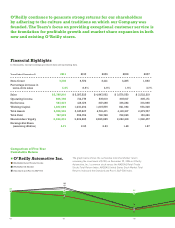
Comparison of Five-Year
Cumulative Return
O’Reilly Automotive Inc.
NASDAQ Retail Trade Stocks
NASDAQ US Market
Standard and Poor’s S&P 500
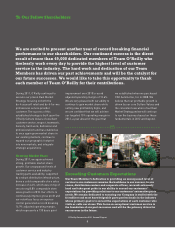
O’Reilly continues to generate strong returns for our shareholders
by adhering to the culture and traditions on which our Company was
founded. The Team’s focus on providing exceptional customer service is
the foundation for profitable growth and market share expansion in both
new and existing O’Reilly stores.
101
96
The graph below shows the cumulative total shareholder return
assuming the investment of $100, on December 29, 2006 in O’Reilly
Automotive, Inc.’s common stock versus the NASDAQ Retail Trade
Stocks Total Return Index, NASDAQ United States Stock Market Total
Returns Index and the Standard and Poor’s S&P 500 Index.
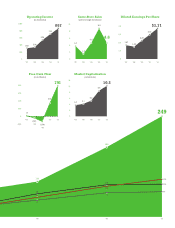
Years Ended December 31 2011 2010 2009 2008 2007
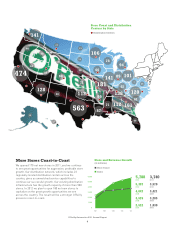
Store Count 3,740 3,570 3,421 3,285 1,830
Percentage increase in
same-store sales 4.6% 8.8% 4.6% 1.5% 3.7%
Sales $ 5,788,816 $ 5,397,525 $ 4,847,062 $ 3,576,553 $ 2,522,319
Operating Income 866,766 712,776 537,619 335,617 305,151
Net Income 507,673 419,373 307,498 186,232 193,988
Working Capital 1,027,600 1,072,294 1,007,576 821,932 573,328
Total Assets 5,500,501 5,047,827 4,781,471 4,193,317 2,279,737
Total Debt 797,574 358,704 790,748 732,695 100,469
Shareholders’ Equity 2,844,851 3,209,685 2,685,865 2,282,218 1,592,477
Earnings Per Share
(assuming dilution) 3.71 2.95 2.23 1.48 1.67
In thousands, except earnings per share data and operating data
Financial Highlights
108
91
63
66
105
66
‘07 ‘08‘06
100