O'Reilly Auto Parts 2011 Annual Report Download - page 3
Download and view the complete annual report
Please find page 3 of the 2011 O'Reilly Auto Parts annual report below. You can navigate through the pages in the report by either clicking on the pages listed below, or by using the keyword search tool below to find specific information within the annual report.-
 1
1 -
 2
2 -
 3
3 -
 4
4 -
 5
5 -
 6
6 -
 7
7 -
 8
8 -
 9
9 -
 10
10 -
 11
11 -
 12
12 -
 13
13 -
 14
14 -
15
-
16
-
17
-
18
-
19
-
20
-
21
-
22
-
23
-
24
-
25
-
26
-
27
-
28
-
29
-
30
-
31
-
32
-
33
-
34
-
35
-
36
-
37
-
38
-
39
-
40
-
41
-
42
-
43
-
44
-
45
-
46
-
47
-
48
-
49
-
50
-
51
-
52
-
53
-
54
-
55
-
56
-
57
-
58
-
59
-
60
-
61
-
62
-
63
-
64
-
65
-
66
-
67
-
68
-
69
-
70
-
71
-
72
-
73
-
74
-
75
-
76
-
77
-
78
-
79
-
80
-
81
-
82
-
83
-
84
-
85
-
86
-
87
-
88
-
89
-
90
-
91
-
92
-
93
-
94
-
95
-
96
-
97
-
98
-
99
-
100
 |
 |

‘07 ‘10 ‘11
‘07 ‘08 ‘09 ‘10 ‘11‘07 ‘08 ‘09 ‘10 ‘11‘07 ‘08 ‘09 ‘10 ‘11
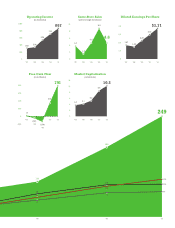
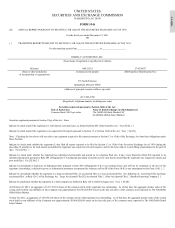
Operating Income
(in millions)
867
713
538
336
305
8.8
4.6
1.5
3.7
Same-Store Sales
(percentage increase)
Diluted Earnings Per Share
4.6
$3.71
2.95
2.23
1.48
1.67
1,000
800
600
400
200
0
338
(130)
(43)
17
Free Cash Flow
(in millions)
791
‘07 ‘08 ‘09 ‘10 ‘11
Market Capitalization
(in billions)
10.2
8.5
5.2
4.1
3.7
‘08
‘09
10
8
6
4
2
0
4.0
3.0
2.0
1.0
0
800
600
400
200
0
-200
12
10
8
6
4
2
0
249
119
188
88
110
124
114
113
95
84
97
99
‘09 ‘10 ‘11