North Face 2013 Annual Report Download - page 32
Download and view the complete annual report
Please find page 32 of the 2013 North Face annual report below. You can navigate through the pages in the report by either clicking on the pages listed below, or by using the keyword search tool below to find specific information within the annual report.-
 1
1 -
2
-
3
-
4
-
5
-
6
-
7
-
8
-
9
-
10
-
11
-
12
-
13
-
14
-
15
-
16
-
17
-
18
-
19
-
20
-
21
-
 22
22 -
 23
23 -
 24
24 -
 25
25 -
 26
26 -
 27
27 -
 28
28 -
 29
29 -
 30
30 -
 31
31 -
 32
32 -
 33
33 -
 34
34 -
 35
35 -
 36
36 -
 37
37 -
 38
38 -
 39
39 -
 40
40
 |
 |

2013 was marked by solid achievements at VF, especially given a global
business environment that faced its share of challenges. And if you know VF,
you know that a challenging business climate brings out the best in our people,
our diverse brands and our powerful business platforms.
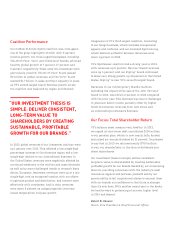
In 2013, we achieved all-time highs in revenue, gross
margin, earnings and cash flow, all while staying sharply
focused on investing in our brands to drive future growth.
It was also the first year of our new five-year plan, and our
results have us nicely on track to deliver against our long-
term targets. Let’s take a closer look:
»Our 2013 revenues increased 5 percent to a record
$11.4 billion, compared with $10.9 billion in 2012.
Leading the way were continued, strong results
from our Outdoor & Action Sports coalition, and our
international and direct-to-consumer businesses,
which created excellent momentum that we expect
to continue into 2014.
»Improvement in gross margin also continued in 2013
with a 160 basis point expansion to reach a record
48.1 percent, reflecting the ongoing shift in our revenue
mix toward higher-margin businesses as well as lower
product costs.
»SG&A as a percent of revenue rose 50 basis points
to 33.6 percent. Marketing alone was up 60 basis
points due to strategic incremental investments. This
indicates leverage in other areas of our business, further
underscoring our commitment to executing the right
investments to maximize returns to our shareholders.
»Adjusted operating margin was 14.5 percent, one of the
highest in our industry, compared with 13.8 percent in
2012. On a GAAP basis, operating margin was 14.4 percent
versus 13.5 percent in 2012.
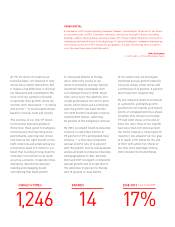
»Net income on an adjusted basis reached $1.2 billion,
compared with $1.1 billion in 2012. That’s an increase
of 13 percent! Adjusted earnings per share in 2013 also
increased 13 percent to $2.73. On a GAAP basis, full year
net income was $1.2 billion, while earnings per share
grew 12 percent to $2.71 per share.
POWERFUL PERFORMANCE
ROBERT K. SHEARER
Senior Vice President and Chief Financial Officer