Nissan 2015 Annual Report Download - page 19
Download and view the complete annual report
Please find page 19 of the 2015 Nissan annual report below. You can navigate through the pages in the report by either clicking on the pages listed below, or by using the keyword search tool below to find specific information within the annual report.-
 1
1 -
2
-
3
-
4
-
5
-
6
-
7
-
8
-
 9
9 -
 10
10 -
 11
11 -
 12
12 -
 13
13 -
 14
14 -
 15
15 -
 16
16 -
 17
17 -
 18
18 -
 19
19 -
 20
20 -
 21
21
 |
 |
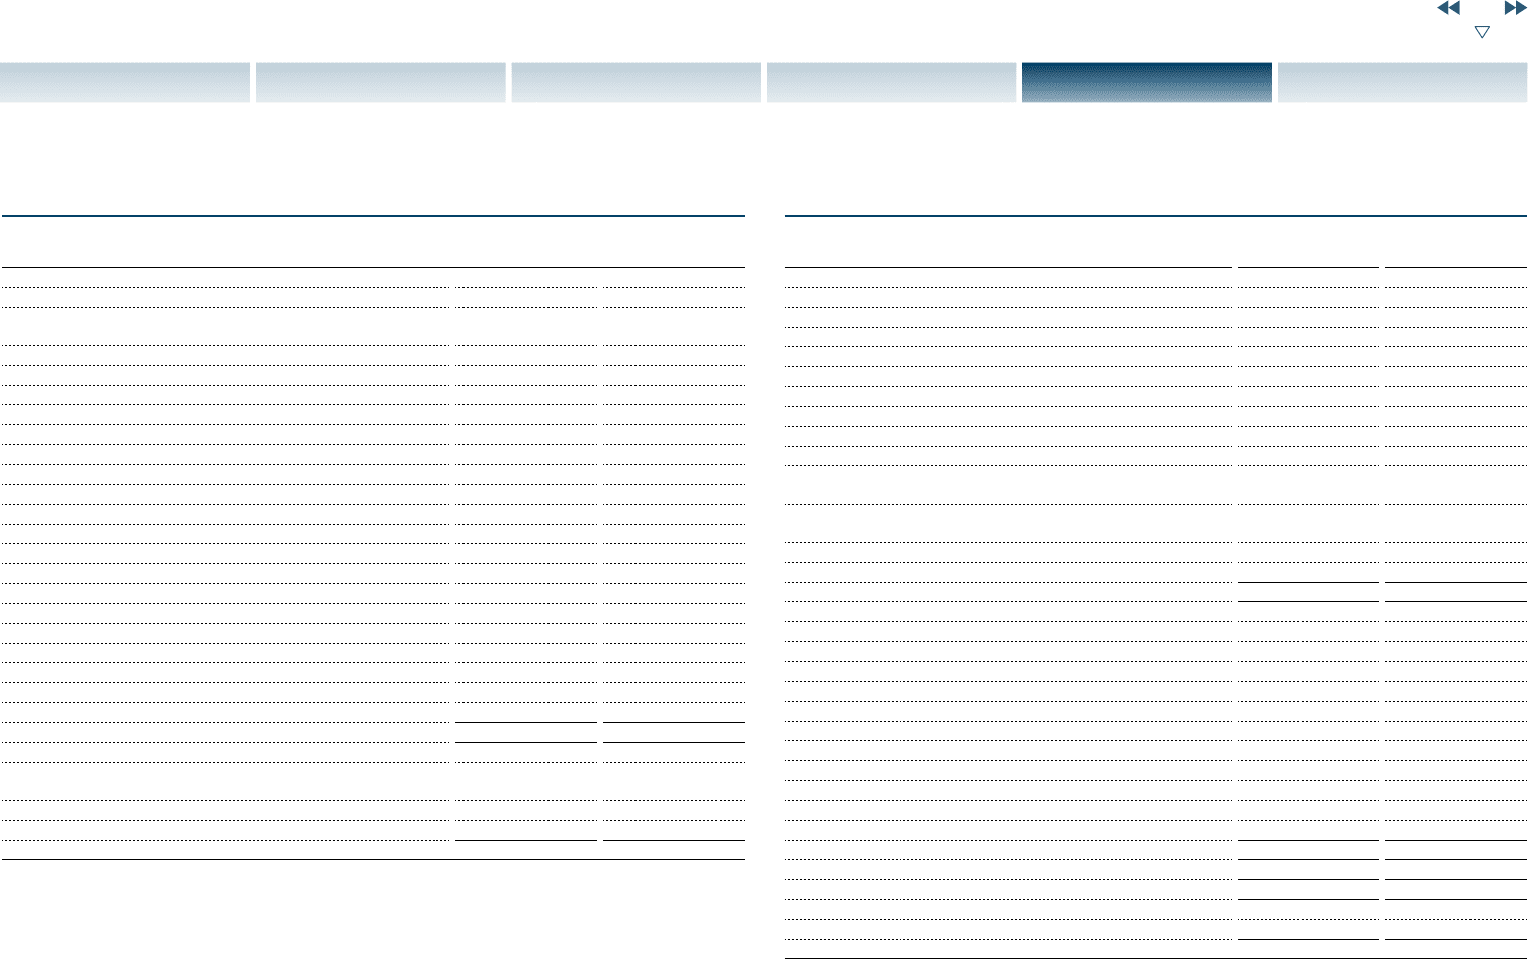
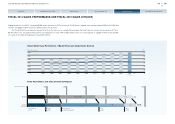
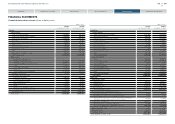
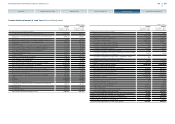
Consolidated statement of cash flows (China JV Equity basis)
(Millions of yen)
FY2013
(From April 1, 2013
to March 31, 2014)
FY2014
(From April 1, 2014
to March 31, 2015)
Cash flows from operating activities
Income before income taxes and minority interests 529,378 687,421
Depreciation and amortization (for fixed assets excluding leased
vehicles) 364,926 398,982
Depreciation and amortization (for long term prepaid expenses) 24,086 28,003
Depreciation and amortization (for leased vehicles) 288,276 355,292
Impairment loss 2,130 16,103
Gain on contribution of securities to retirement benefit trust (12,175) (17,725)
Increase (decrease) in allowance for doubtful receivables 12,160 13,471
Loss (gain) for residual value risk of leased vehicles 11,633 41,911
Interest and dividend income (23,077) (31,748)
Interest expense 101,451 112,823
Equity in losses (earnings) of affiliates (78,815) (106,513)
Loss (gain) on sales of fixed assets (7,474) (16,709)
Loss on disposal of fixed assets 11,456 17,069
Decrease (increase) in trade notes and accounts receivable (173,228) (64,118)
Decrease (increase) in sales finance receivables (587,060) (707,321)
Decrease (increase) in inventories (38,057) (82,435)
Increase (decrease) in trade notes and accounts payable 334,367 125,840
Amortization of net retirement benefit obligation at transition 9,075 9,098
Retirement benefit expenses 37,701 26,789
Payments relared to net defined benefit assets and liability (36,658) (25,815)
Other 34,749 53,350
Subtotal 804,844 833,768
Interest and dividends received 20,654 25,793
Proceeds from dividends income from affiliates accounted for by
equity method 98,907 145,780
Interest paid (99,861) (114,659)
Income taxes paid (96,421) (197,899)
Net cash provided by operating activities 728,123 692,747
(Millions of yen)
FY2013
(From April 1, 2013
to March 31, 2014)
FY2014
(From April 1, 2014
to March 31, 2015)
Cash flows from investing activities
Net decrease (increase) in short-term investments (3,360) 3,405
Purchase of fixed assets (551,808) (513,268)
Proceeds from sales of fixed assets 79,578 88,318
Purchase of leased vehicles (1,004,141) (1,070,654)
Proceeds from sales of leased vehicles 465,501 537,721
Payments of long-term loans receivable (1,292) (534)
Collection of long-term loans receivable 254 310
Purchase of investment securities (37,617) (25,591)
Proceeds from sales of investment securities 2,223 6,104
Proceeds from (payments for) sales of subsidiaries' shares resulting
in changes in the scope of consolidation (1,321) (156)
Proceeds from (payments for) purchase of subsidiaries' shares
resulting in changes in the scope of consolidation 972 ―
Net decrease (increase) in restricted cash (8,628) (36,258)
Other (20,777) (11,422)
Net cash used in investing activities (1,080,416) (1,022,025)
Cash flows from financing activities
Net increase (decrease) in short-term borrowings (19,920) 445,170
Proceeds from long-term borrowings 1,373,644 981,970
Proceeds from issuance of bonds 444,666 325,513
Repayments of long-term borrowings (1,058,838) (1,094,942)
Redemption of bonds (181,628) (238,124)
Proceeds from minority shareholders 9,599 6,242
Purchase of treasury stock (11) (61)
Proceeds from sales of treasury stock 127 618
Repayments of lease obligations (44,312) (34,047)
Cash dividends paid (115,265) (132,054)
Cash dividends paid to minority shareholders (11,137) (14,389)
Net cash provided by financing activities 396,925 245,896
Effects of exchange rate changes on cash and cash equivalents 74,850 50,660
Increase (decrease) in cash and cash equivalents 119,482 (32,722)
Cash and cash equivalents at beginning of the period 711,901 832,716
Increase due to inclusion in consolidation 1,333 2,618
Cash and cash equivalents at end of the period 832,716 802,612
18
NISSAN MOTOR CORPORATION ANNUAL REPORT 2015
PERFORMANCE
CONTENTS
TOP MESSAGE
NISSAN POWER 88
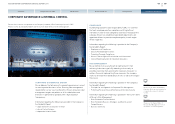
CORPORATE GOVERNANCE
CORPORATE FACE TIME