Nissan 2015 Annual Report Download - page 16
Download and view the complete annual report
Please find page 16 of the 2015 Nissan annual report below. You can navigate through the pages in the report by either clicking on the pages listed below, or by using the keyword search tool below to find specific information within the annual report.-
 1
1 -
2
-
3
-
4
-
5
-
 6
6 -
 7
7 -
 8
8 -
 9
9 -
 10
10 -
 11
11 -
 12
12 -
 13
13 -
 14
14 -
 15
15 -
 16
16 -
 17
17 -
 18
18 -
 19
19 -
 20
20 -
 21
21
 |
 |
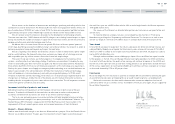
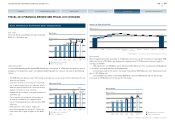
In our outlook for fiscal 2015, we expect our global sales to reach 5.55 million units, an increase
of 4.4% compared to fiscal 2014.
With a total industry volume assumption of 85.44 million units, a 0.1 % increase year on year,
our global market share is expected to grow from 6.2% to 6.5%.
In consequence of our plan, the financial forecast is as follows. We have used a foreign exchange
rate assumption of 115 yen to the dollar and 130 yen to the euro:
Nissan’s Fiscal 2015 Outlook
n Net sales 12.10 trillion yen
n Operating profit 675.0 billion yen
n Net income 485.0 billion yen
Fiscal 2015 Outlook (China JV Equity Basis)
4.5
%
600
450
300
150
0
2010 201420132011 2012
312.0
406.4
468.7
536.3
463.1
2015
550.0
3.6
%
4.3
%
5.4
%
5.1
%
4.1
%
600
450
300
150
0
2010 2015
201420132011 2012
530.0
399.3 428.0 457.8
500.6 506.1
4.4
%
4.6
%
4.5
%
5.2
%
4.8
%
4.4
%
(Forecast)
(Forecast)
(Billions of yen)
Dividend
Nissan’s strategic actions reflect not only its long-term vision as a global company to create sustainable
value but also the company’s commitment to maximizing total shareholder returns.
We paid year-end cash dividends of 16.5 yen per share for fiscal 2014. As a result, the total
dividend payment for fiscal 2014, combined with the 16.5 yen dividend for the interim period, was 33
yen per share.
The dividend payment
plan for fiscal 2015 is to be
42 yen per share,
considering the business
condition, risks and
opportunities for the year.
(FY)
Sales finance
Due to the increase in retail sales, total financial assets of the sales finance segment increased by
20.8% to 9,281.3 billion yen from 7,682.1 billion yen in fiscal 2013. The sales finance segment
generated 195.5 billion yen in operating profits in fiscal 2014 from 164.7 billion yen in fiscal 2013.
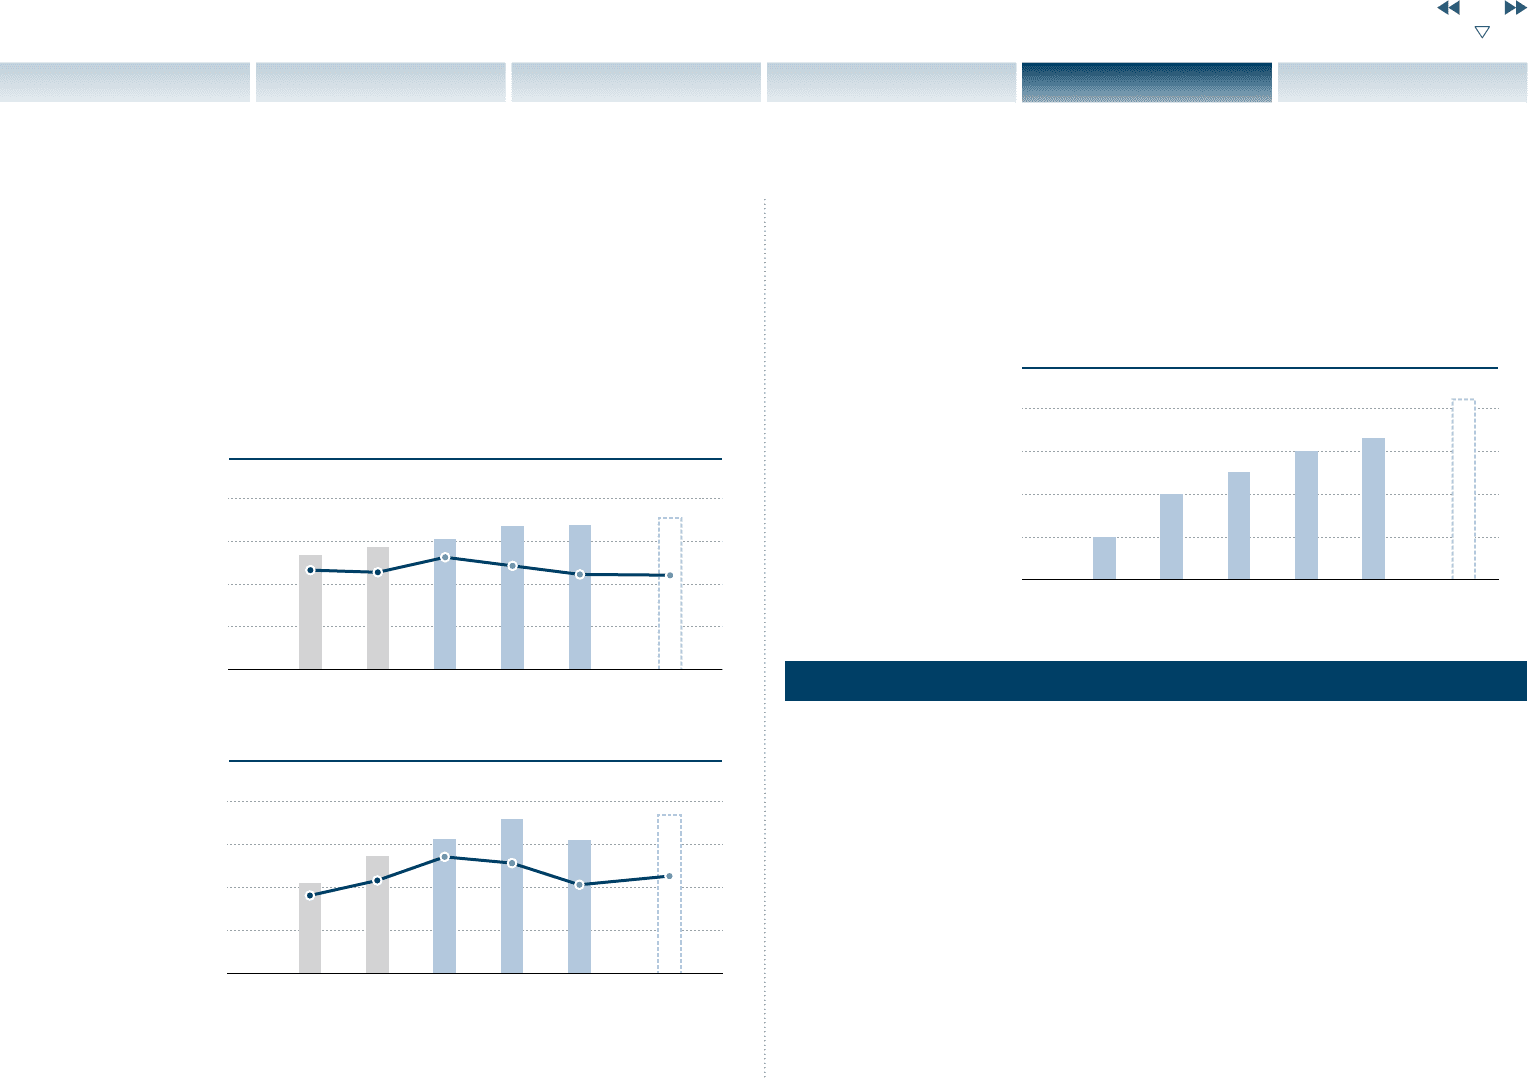
Investment policy
Capital expenditures totaled 463.1 billion yen, which was 4.1% of net sales. The company used capital
expenditures in order to ensure Nissan’s future competitiveness.
R&D expenditures totaled 506.1 billion yen. These funds were used to develop new technologies
and products. One of the
company’s strengths is its
extensive collaboration
and development
structure with Renault’s
R&D team, resulting from
the Alliance.
R&D Expenditures
40
30
20
10
0
2014 2015201320122010 2011
42
10
20
25
30
33
(Outlook)
(FY)
Dividend
(Dividend per share, in yen)
(Billions of yen)
Capital Expenditures
(FY)
■ Management pro forma basis*
■ China JV equity basis
● % of net sales (Management pro forma basis*)
● % of net sales (China JV equity basis)
* Based on continuation of proportionate consolidation of China JV
15
NISSAN MOTOR CORPORATION ANNUAL REPORT 2015
PERFORMANCE
CONTENTS
TOP MESSAGE
NISSAN POWER 88
CORPORATE GOVERNANCE
CORPORATE FACE TIME