Nissan 2015 Annual Report Download - page 12
Download and view the complete annual report
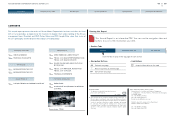
Please find page 12 of the 2015 Nissan annual report below. You can navigate through the pages in the report by either clicking on the pages listed below, or by using the keyword search tool below to find specific information within the annual report.-
 1
1 -
 2
2 -
 3
3 -
 4
4 -
 5
5 -
 6
6 -
 7
7 -
 8
8 -
 9
9 -
 10
10 -
 11
11 -
 12
12 -
 13
13 -
 14
14 -
 15
15 -
 16
16 -
 17
17 -
 18
18 -
 19
19 -
 20
20 -
 21
21
 |
 |
3,000
1,000
2,000
4,000
6,000
5,000
0
6.0
2.0
4.0
8.0
12.0
10.0
0
2005 2006 2007 2008 2009 2010 2011 2012 2013 2014
3,569
5.6%
3,483
5.4%
3,770
5.4%
3,411
5.5%
3,515
5.5%
4,518
5.8%
4,845
6.4%
4,914
6.2%
5,188 5,318
2015
5,550
6.2% 6.2% 6.5%
6,0005,0004,0003,0002,0001,0000
5,318
5,550
+4.4%
889 755 1,829 (1,400) 1,222 623
940 790 1,920 (1,490) 1,300 600
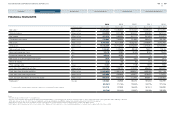
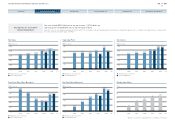
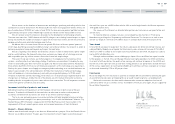
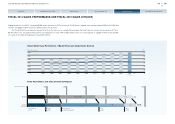
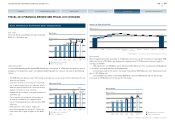
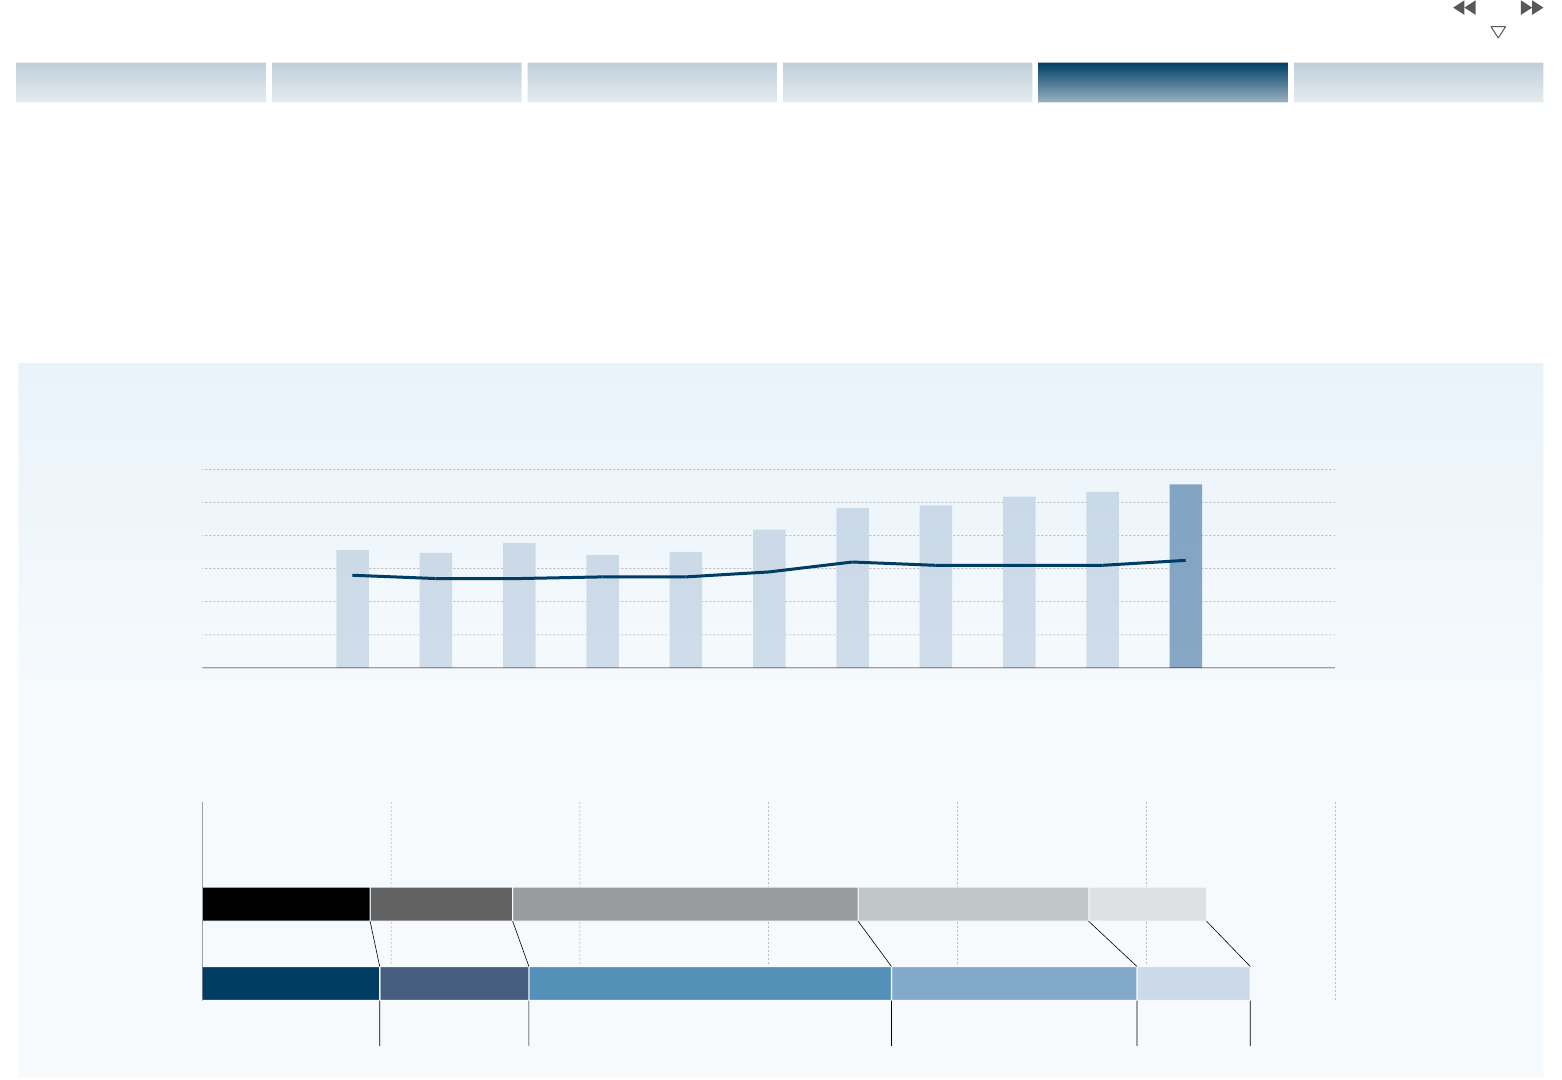
FISCAL 2014 SALES PERFORMANCE AND FISCAL 2015 SALES OUTLOOK
Global demand in fiscal 2014 reached 85.36 million vehicles, up 2.7% from fiscal 2013. Nissan’s global sales volume climbed 2.5% to 5.318 million
vehicles and global market share was 6.2%, equal to fiscal 2013.
For fiscal 2015, Nissan expects to grow faster than the industry as a whole. We anticipate that total industry volumes will increase by 0.1% to
85.44 million units. Our global retail volumes are expected to rise by 4.4% to 5.55 million units. This would equate to a global market share of 6.5%,
an increase of 0.3 percentage points compared to 2014.
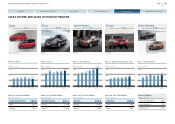
Sales Performance and Sales Outlook by Regions
(FY)
(Units: thousands) (%)
Japan
–3.7%
China
+6.4%
North America
+5.0% (U.S.+6.4%)
Europe
+4.6%
Other Markets
+5.7%
(Forecast)
FY2014
FY2015
(Units: thousands)
(Forecast)
Global Retail Sales Performance / Market Share and Global Sales Outlook
11
NISSAN MOTOR CORPORATION ANNUAL REPORT 2015
PERFORMANCE
CONTENTS
TOP MESSAGE
NISSAN POWER 88
CORPORATE GOVERNANCE
CORPORATE FACE TIME