Nissan 2015 Annual Report Download - page 14
Download and view the complete annual report
Please find page 14 of the 2015 Nissan annual report below. You can navigate through the pages in the report by either clicking on the pages listed below, or by using the keyword search tool below to find specific information within the annual report.-
 1
1 -
2
-
3
-
 4
4 -
 5
5 -
 6
6 -
 7
7 -
 8
8 -
 9
9 -
 10
10 -
 11
11 -
 12
12 -
 13
13 -
 14
14 -
 15
15 -
 16
16 -
 17
17 -
 18
18 -
 19
19 -
 20
20 -
 21
21
 |
 |
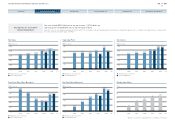
498.4
589.6
+32.4 –43.8 –39.5 –0.1 –20.1 –19.0
+68.6
+112.7
800
600
400
200
0
2015201420132010 2011 2012
537.5 545.8 523.5
605.7
498.4
718.6 675.0
589.6
835.0
(Forecast)
(Billions of yen)
(FY)
Operating Profit
(Billions of yen)
2015201420132011 2012
319.2 341.4 342.4
389.0
457.6
485.0
2010
600
450
300
150
0
(Forecast)
(Billions of yen)
(FY)
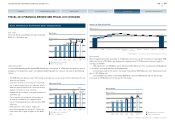
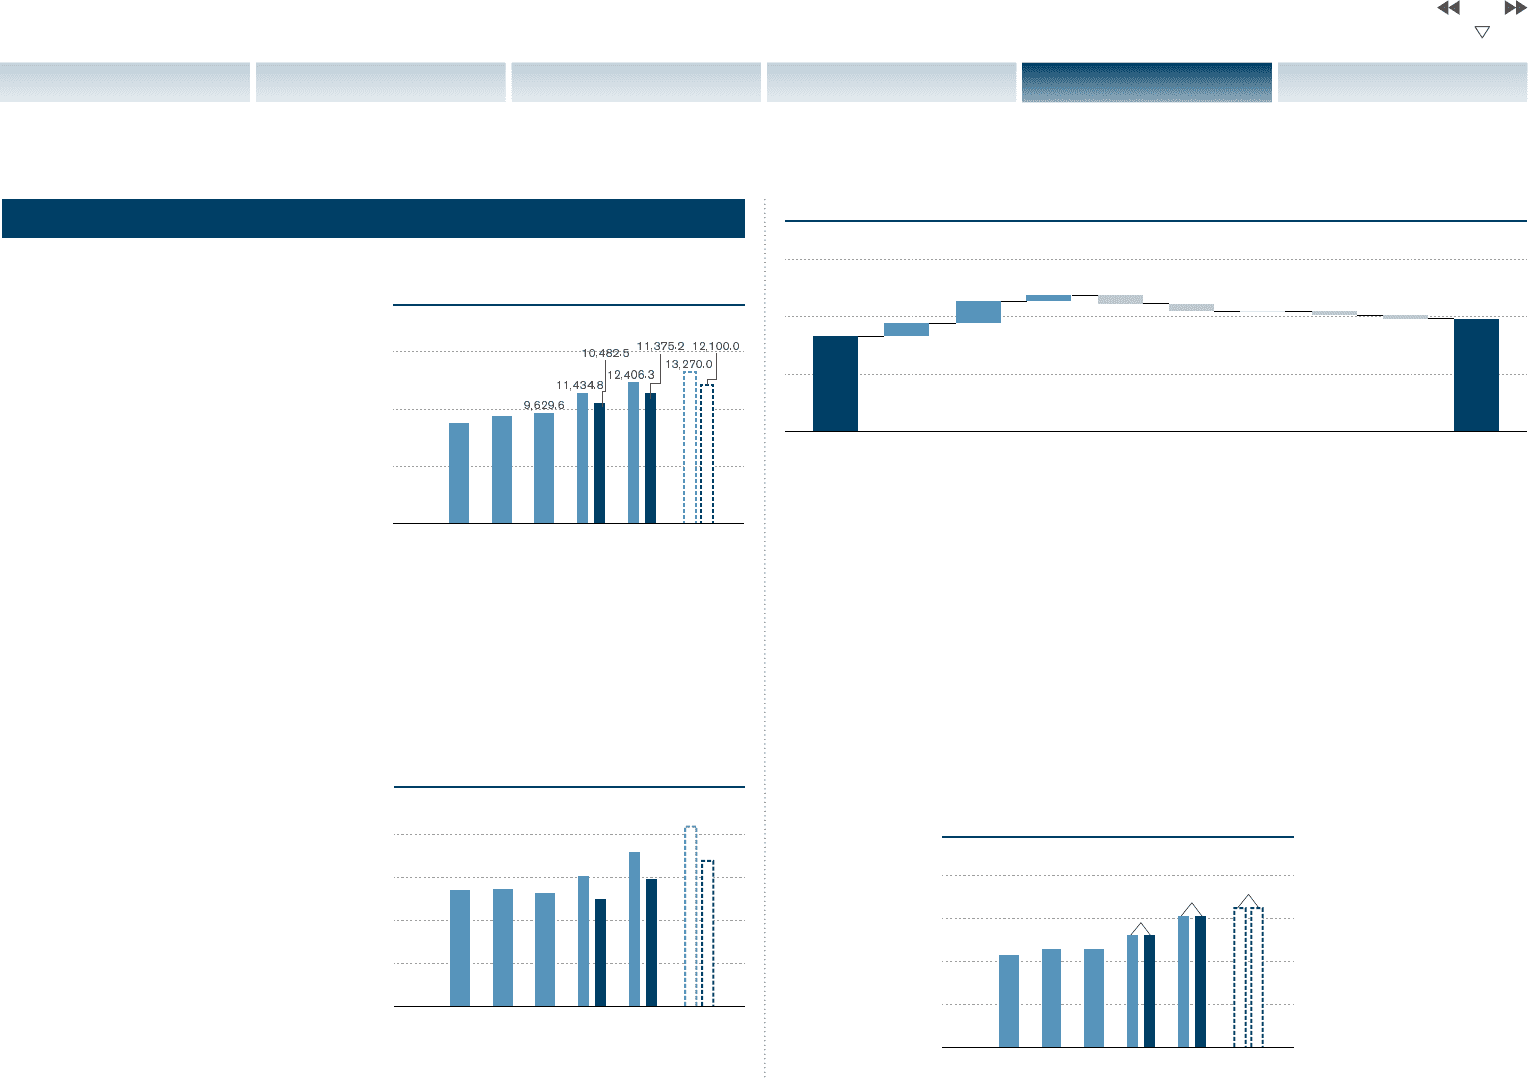
Net sales
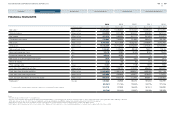
For fiscal 2014, consolidated net sales increased
8.5%, to 11.38 trillion yen.
Operating profit
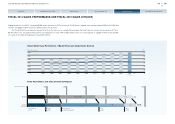
Consolidated operating profit totaled 589.6 billion yen, an increase of 18.3% from the previous year. In
comparison to the previous year’s consolidated operating profit, the variance was due to the following
factors:
l The 68.6 billion yen positive impact from foreign exchange rates came mainly from the correction of the yen
against the U.S. dollar.
l Cost items resulted in net savings of 112.7 billion
yen, as purchasing material cost-reduction efforts
were only partially offset by cost increases due to
product enrichment and raw materials.
l Volume and mix resulted in a net positive impact of
32.4 billion yen.
l The increase in marketing and selling expenses
resulted in a 43.8 billion yen negative impact.
l U.S. re-marketing performance decreased by 39.5
billion yen.
l R&D expenses increased by 0.1 billion yen.
l Manufacturing expenses rose by 20.1 billion yen.
l Other items had a negative impact of 19.0 billion
yen.
FISCAL 2014 FINANCIAL REVIEW AND FISCAL 2015 OUTLOOK
Net income
Net non-operating income amounted to 104.6 billion yen for the current fiscal year, increasing by 75.8
billion yen due to a 79.3 billion yen foreign exchange gain and 27.7 billion yen increase in equity in
earnings of affiliates.
Net special loss was 6.8 billion yen, a decrease of 9.0 billion yen. This was primarily attributable to
a 16.1 billion yen impairment loss of fixed benefits.
Income taxes paid for the current fiscal year increased by 82.2 billion yen from the previous fiscal
year to 197.3 billion yen.
Consolidated net income increased by 68.6 billion yen from 389.0 billion yen for the previous
fiscal year to 457.6 billion yen for the current fiscal year.
Fiscal 2014 Financial Performance (China JV Equity Basis) Impact on Operating Profit
FY13 O.P. Cost items*
* Including purch. cost reduction, raw material and product enrichment.
Marketing &
selling exp.
R&D exp.FOREX Volume/mix US
re-marketing
MFG exp. Other items FY14 O.P.
Net Income
■ Management pro forma basis*
■ China JV equity basis
■ Management pro forma basis*
■ China JV equity basis
■ Management pro forma basis*
■ China JV equity basis
2015201420132011 2012
8,773.1 9,409.0
2010
0
5,000
10,000
15,000
(Forecast)
Net Sales
(Billions of yen)
(FY)
* Based on continuation of proportionate consolidation of China JV
13
NISSAN MOTOR CORPORATION ANNUAL REPORT 2015
PERFORMANCE
CONTENTS
TOP MESSAGE
NISSAN POWER 88
CORPORATE GOVERNANCE
CORPORATE FACE TIME