Navy Federal Credit Union 2005 Annual Report Download - page 39
Download and view the complete annual report
Please find page 39 of the 2005 Navy Federal Credit Union annual report below. You can navigate through the pages in the report by either clicking on the pages listed below, or by using the keyword search tool below to find specific information within the annual report.-
 1
1 -
2
-
3
-
4
-
5
-
6
-
7
-
8
-
9
-
10
-
11
-
12
-
13
-
14
-
15
-
16
-
17
-
18
-
19
-
20
-
21
-
22
-
23
-
24
-
25
-
26
-
27
-
28
-
 29
29 -
 30
30 -
 31
31 -
 32
32 -
 33
33 -
 34
34 -
 35
35 -
 36
36 -
 37
37 -
 38
38 -
 39
39 -
 40
40 -
 41
41 -
 42
42 -
 43
43 -
 44
44 -
 45
45 -
 46
46 -
 47
47 -
 48
48 -
 49
49
 |
 |

9
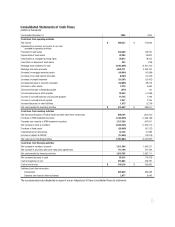
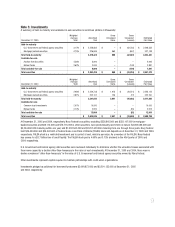
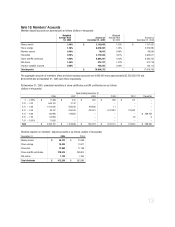
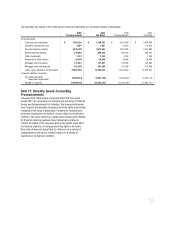
Note 3: Investments
A summary of held-to-maturity and available-for-sale securities is as follows
(dollars in thousands):
At December 31, 2005 and 2004, respectively, Navy Federal’s securities, excluding $326,845,000 and $332,107,000 in mortgage-
backed securities and $88,110,000 and $78,716,000 in other securities, were predominantly short-term in nature; $3,960,086,000 and
$4,244,068,000 maturing within one year, and $1,932,560,000 and $2,257,629,000 maturing from one through three years. Navy Federal
held $26,494,000 and $26,492,000 of Federal Home Loan Bank of Atlanta (FHLBA) stock and deposits as of December 31, 2005 and 2004,
respectively. FHLBA stock is a restricted investment and is carried at cost, which is par value. As a member of the FHLBA, Navy Federal
has access to a $3.7 billion line of credit facility. The FHLBA stock paid a 4.60% and 3.75% dividend in the 4th Quarter of 2005 and
2004, respectively.
U.S. Government and federal agency debt securities were reviewed individually to determine whether the unrealized losses associated with
them were caused by a decline other-than-temporary in the value of such investments. At December 31, 2005 and 2004, there was no
decline considered “other-than-temporary” in the value of U.S. Government and federal agency securities owned by Navy Federal.
Other investments represent capital required to maintain partnerships with credit union organizations.
Investments pledged as collateral for borrowed funds were $2,690,873,000 and $2,591,132,000 at December 31, 2005
and 2004, respectively.
December 31, 2005
Weighted
Average
Yield
Amortized
Cost
Gross
Unrealized
Gains
Gross
Unrealized
(Losses)
Estimated
Fair Value
Held-to-maturity
U.S. Government and federal agency securities 3.17% $ 2,548,583 $–$ (42,250) $ 2,506,333
Mortgage-backed securities 4.75% 326,845 960 (657) 327,148
Total held-to-maturity 2,875,428 960 (42,907) 2,833,481
Available-for-sale
Auction Rate Securities 4.36% 5,000 – – 5,000
Mutual funds 3.62% 3,000 – (109) 2,891
Total available-for-sale 8,000 – (109) 7,891
Total securities $ 2,883,428 $ 960 $ (43,016) $ 2,841,372
December 31, 2004
Weighted
Average
Yield
Amortized
Cost
Gross
Unrealized
Gains
Gross
Unrealized
(Losses)
Estimated
Fair Value
Held-to-maturity
U.S. Government and federal agency securities 2.96% $ 2,259,738 $ 1,915 $ (16,531) $ 2,245,122
Mortgage-backed securities 2.81% 332,107 726 (72) 332,761
Total held-to-maturity 2,591,845 2,641 (16,603) 2,577,883
Available-for-sale
Common trust investments 2.07% 10,000 – – 10,000
Mutual funds 2.70% 3,000 – (85) 2,915
Total available-for-sale 13,000 – (85) 12,915
Total securities $ 2,604,845 $ 2,641 $ (16,688) $ 2,590,798