NVIDIA 2012 Annual Report Download - page 87
Download and view the complete annual report
Please find page 87 of the 2012 NVIDIA annual report below. You can navigate through the pages in the report by either clicking on the pages listed below, or by using the keyword search tool below to find specific information within the annual report.-
 1
1 -
2
-
3
-
4
-
5
-
6
-
7
-
8
-
9
-
10
-
11
-
12
-
13
-
14
-
15
-
16
-
17
-
18
-
19
-
20
-
21
-
22
-
23
-
24
-
25
-
26
-
27
-
28
-
29
-
30
-
31
-
32
-
33
-
34
-
35
-
36
-
37
-
38
-
39
-
40
-
41
-
42
-
43
-
44
-
45
-
46
-
47
-
48
-
49
-
50
-
51
-
52
-
53
-
54
-
55
-
56
-
57
-
58
-
59
-
60
-
61
-
62
-
63
-
64
-
65
-
66
-
67
-
68
-
69
-
70
-
71
-
72
-
73
-
74
-
75
-
76
-
 77
77 -
 78
78 -
 79
79 -
 80
80 -
 81
81 -
 82
82 -
 83
83 -
 84
84 -
 85
85 -
 86
86 -
 87
87 -
 88
88 -
 89
89 -
 90
90 -
 91
91 -
 92
92 -
 93
93 -
 94
94 -
 95
95 -
 96
96 -
 97
97 -
98
-
99
-
100
-
101
-
102
-
103
-
104
-
105
-
106
-
107
-
108
-
109
-
110
-
111
-
112
-
113
-
114
-
115
-
116
-
117
-
118
-
119
-
120
 |
 |

Table of Contents NVIDIA CORPORATION AND SUBSIDIARIES
NOTES TO THE CONSOLIDATED FINANCIAL STATEMENTS
(Continued)
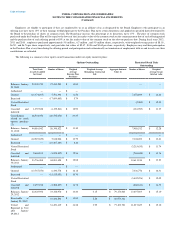
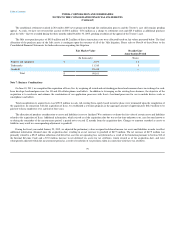
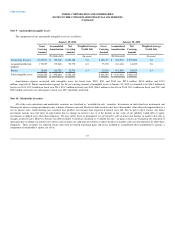
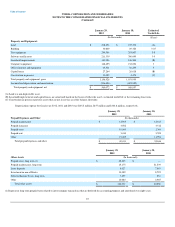
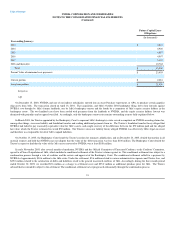
The following is a summary of cash equivalents and marketable securities at January 29, 2012 and January 30, 2011:
January 29, 2012
Amortized
Cost Unrealized
Gain Unrealized
Loss Estimated
Fair Value
(In thousands)
Debt securities of United States government agencies $ 769,300 $ 1,605 $ (151) $ 770,754
Corporate debt securities 1,114,439 3,268 (260) 1,117,447
Mortgage backed securities issued by United States government-sponsored enterprises 156,668 4,964 (73) 161,559
Money market funds 290,732 — — 290,732
Debt securities issued by United States Treasury 533,616 2,161 (3) 535,774
Total $ 2,864,755 $ 11,998 $ (487) $ 2,876,266
Classified as:
Cash equivalents $ 414,566
Marketable securities 2,461,700
Total $ 2,876,266
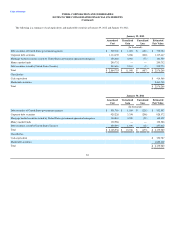
January 30, 2011
Amortized
Cost Unrealized
Gain Unrealized
Loss Estimated
Fair Value
(In thousands)
Debt securities of United States government agencies $ 531,789 $ 1,034 $ (226) $ 532,597
Corporate debt securities 925,226 3,354 (208) 928,372
Mortgage backed securities issued by United States government-sponsored enterprises 140,844 4,599 (21) 145,422
Money market funds 132,586 — — 132,586
Debt securities issued by United States Treasury 435,091 1,939 (18) 437,012
Total $ 2,165,536 $ 10,926 $ (473) $ 2,175,989
Classified as:
Cash equivalents $ 350,787
Marketable securities 1,825,202
Total $ 2,175,989
84