NVIDIA 2012 Annual Report Download - page 103
Download and view the complete annual report
Please find page 103 of the 2012 NVIDIA annual report below. You can navigate through the pages in the report by either clicking on the pages listed below, or by using the keyword search tool below to find specific information within the annual report.-
 1
1 -
2
-
3
-
4
-
5
-
6
-
7
-
8
-
9
-
10
-
11
-
12
-
13
-
14
-
15
-
16
-
17
-
18
-
19
-
20
-
21
-
22
-
23
-
24
-
25
-
26
-
27
-
28
-
29
-
30
-
31
-
32
-
33
-
34
-
35
-
36
-
37
-
38
-
39
-
40
-
41
-
42
-
43
-
44
-
45
-
46
-
47
-
48
-
49
-
50
-
51
-
52
-
53
-
54
-
55
-
56
-
57
-
58
-
59
-
60
-
61
-
62
-
63
-
64
-
65
-
66
-
67
-
68
-
69
-
70
-
71
-
72
-
73
-
74
-
75
-
76
-
77
-
78
-
79
-
80
-
81
-
82
-
83
-
84
-
85
-
86
-
87
-
88
-
89
-
90
-
91
-
92
-
 93
93 -
 94
94 -
 95
95 -
 96
96 -
 97
97 -
 98
98 -
 99
99 -
 100
100 -
 101
101 -
 102
102 -
 103
103 -
 104
104 -
 105
105 -
 106
106 -
 107
107 -
 108
108 -
 109
109 -
 110
110 -
 111
111 -
 112
112 -
 113
113 -
114
-
115
-
116
-
117
-
118
-
119
-
120
 |
 |

Table of Contents NVIDIA CORPORATION AND SUBSIDIARIES
NOTES TO THE CONSOLIDATED FINANCIAL STATEMENTS
(Continued)
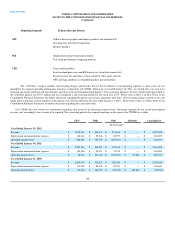
Reporting Segments Primary Revenue Sources
GPU GeForce discrete graphics and chipset products and notebook PCs
Licensing fees from Intel Corporation
Memory products
PSB Quadro professional workstation products
Tesla high-performance computing products
CPB Tegra mobile products
Icera baseband processors and RF transceivers for mobile connectivity
Royalty license fees and other revenue related to video game consoles
GPU and Tegra products in embedded products and automobiles
The “All Other” category includes non-recurring charges and benefits that we do not allocate to our operating segments as these items are not
included in the segment operating performance measures evaluated by our CODM. During the year ended January 30, 2011, we entered into a six-year cross
licensing agreement with Intel and also mutually agreed to settle all outstanding legal disputes. For accounting purposes, the fair valued benefit prescribed to
the settlement portion was $57.0 million and was considered a non-recurring benefit for the fiscal year 2011. Please refer to Note 4 of these Notes to the
Consolidated Financial Statements for further discussion regarding the patent cross license agreement with Intel. Non-recurring charges related to our cash
tender offer to purchase certain employee stock options were $140.2 million for the year ended January 31, 2010. Please refer to Note 2 of these Notes to the
Consolidated Financial Statements for further discussion regarding the cash tender offer.
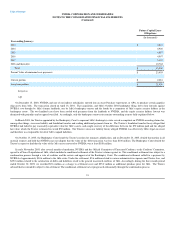
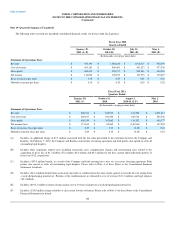
Our CODM does not review any information regarding total assets on an operating segment basis. Operating segments do not record intersegment
revenue, and, accordingly, there is none to be reported. The accounting policies for segment reporting are the same as for NVIDIA as a whole.
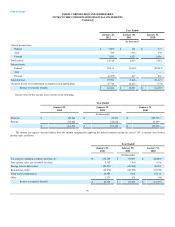
GPU PSB CPB All Other Consolidated
(In thousands)
Year Ended January 29, 2012:
Revenue $ 2,542,430 $ 864,334 $ 591,166 $ — $ 3,997,930
Depreciation and amortization expense $ 118,644 $ 22,564 $ 62,997 $ — $ 204,205
Operating income (loss) $ 528,242 $ 327,970 $ (207,913) $ — $ 648,299
Year Ended January 30, 2011:
Revenue $ 2,527,144 $ 818,552 $ 197,613 $ — $ 3,543,309
Depreciation and amortization expense $ 126,536 $ 26,711 $ 33,742 $ — $ 186,989
Operating income (loss) $ 30,154 $ 321,944 $ (153,351) $ 57,000 $ 255,747
Year Ended January 31, 2010:
Revenue $ 2,660,176 $ 510,223 $ 156,046 $ — $ 3,326,445
Depreciation and amortization expense $ 139,298 $ 28,443 $ 28,923 $ — $ 196,664
Operating income (loss) $ (13,487) $ 148,953 $ (94,170) $ (140,241) $ (98,945)
100