Merck 2014 Annual Report Download - page 4
Download and view the complete annual report
Please find page 4 of the 2014 Merck annual report below. You can navigate through the pages in the report by either clicking on the pages listed below, or by using the keyword search tool below to find specific information within the annual report.-
 1
1 -
 2
2 -
 3
3 -
 4
4 -
 5
5 -
 6
6 -
 7
7 -
 8
8 -
 9
9 -
 10
10 -
 11
11 -
 12
12 -
 13
13 -
 14
14 -
 15
15 -
16
-
17
-
18
-
19
-
20
-
21
-
22
-
23
-
24
-
25
-
26
-
27
-
28
-
29
-
30
-
31
-
32
-
33
-
34
-
35
-
36
-
37
-
38
-
39
-
40
-
41
-
42
-
43
-
44
-
45
-
46
-
47
-
48
-
49
-
50
-
51
-
52
-
53
-
54
-
55
-
56
-
57
-
58
-
59
-
60
-
61
-
62
-
63
-
64
-
65
-
66
-
67
-
68
-
69
-
70
-
71
-
72
-
73
-
74
-
75
-
76
-
77
-
78
-
79
-
80
-
81
-
82
-
83
-
84
-
85
-
86
-
87
-
88
-
89
-
90
-
91
-
92
-
93
-
94
-
95
-
96
-
97
-
98
-
99
-
100
-
101
-
102
-
103
-
104
-
105
-
106
-
107
-
108
-
109
-
110
-
111
-
112
-
113
-
114
-
115
-
116
-
117
-
118
-
119
-
120
-
121
-
122
-
123
-
124
-
125
-
126
-
127
-
128
-
129
-
130
-
131
-
132
-
133
-
134
-
135
-
136
-
137
-
138
-
139
-
140
-
141
-
142
-
143
-
144
-
145
-
146
-
147
-
148
-
149
-
150
-
151
-
152
-
153
-
154
-
155
-
156
-
157
-
158
-
159
-
160
-
161
-
162
-
163
-
164
-
165
-
166
-
167
-
168
-
169
-
170
-
171
-
172
-
173
-
174
-
175
-
176
-
177
-
178
-
179
-
180
-
181
-
182
-
183
-
184
-
185
-
186
-
187
-
188
-
189
-
190
-
191
-
192
-
193
-
194
-
195
-
196
-
197
-
198
-
199
-
200
-
201
-
202
-
203
-
204
-
205
-
206
-
207
-
208
-
209
-
210
-
211
-
212
-
213
-
214
-
215
-
216
-
217
-
218
-
219
-
220
-
221
-
222
-
223
-
224
-
225
-
226
-
227
-
228
-
229
-
230
-
231
-
232
-
233
-
234
-
235
-
236
-
237
-
238
-
239
-
240
-
241
-
242
-
243
-
244
-
245
-
246
-
247
-
248
-
249
-
250
-
251
-
252
-
253
-
254
-
255
-
256
-
257
-
258
-
259
-
260
-
261
-
262
-
263
-
264
-
265
-
266
-
267
-
268
-
269
-
270
-
271
 |
 |

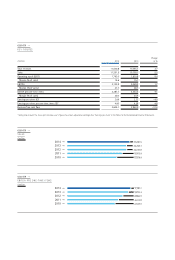
11,291.5
10,700.1
10,740.8
9,905.9
2014 →
2013 →
2012 →
2011 →
8,928.9
2010 →
3,253.3
2,964.9
2,723.8
2014 →
2013 →
2012 →
2011 →
2,545.0
2010 →
3,387.7
GROUP →
KEY FIGURES
€ million 2014 2013
Change
in %
Total revenues 11,500.8 11,095.1 3.7
Sales 11,291.5 10,700.1 5.5
Operating result (EBIT) 1,762.0 1,610.8 9.4
Margin (% of sales) 15.6 15.1
EBITDA 3,122.9 3,069.2
1.7
Margin (% of sales)
27.7 28.7
EBITDA pre one-time items
3,387.7 3,253.3
4.1
Margin (% of sales) 30.0 30.4
Earnings per share (€)12.66 2.77 –4.0
Earnings per share pre one-time items (€)14.60 4.39 4.8
Business free cash flow 2,605.1 2,960.0
–12.0
1
Taking into account the share split; previous year’s figures have been adjusted accordingly. See “Earnings per share” in the Notes to the Consolidated Financial Statements.
GROUP →
SALES
€ million
GROUP →
EBITDA PRE ONE-TIME ITEMS
€ million