LG 2005 Annual Report Download - page 70
Download and view the complete annual report
Please find page 70 of the 2005 LG annual report below. You can navigate through the pages in the report by either clicking on the pages listed below, or by using the keyword search tool below to find specific information within the annual report.-
 1
1 -
2
-
3
-
4
-
5
-
6
-
7
-
8
-
9
-
10
-
11
-
12
-
13
-
14
-
15
-
16
-
17
-
18
-
19
-
20
-
21
-
22
-
23
-
24
-
25
-
26
-
27
-
28
-
29
-
30
-
31
-
32
-
33
-
34
-
35
-
36
-
37
-
38
-
39
-
40
-
41
-
42
-
43
-
44
-
45
-
46
-
47
-
48
-
49
-
50
-
51
-
52
-
53
-
54
-
55
-
56
-
57
-
58
-
59
-
 60
60 -
 61
61 -
 62
62 -
 63
63 -
 64
64 -
 65
65 -
 66
66 -
 67
67 -
 68
68 -
 69
69 -
 70
70 -
 71
71 -
 72
72 -
 73
73 -
 74
74
 |
 |

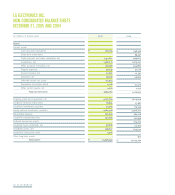
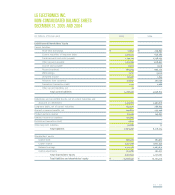
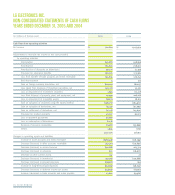
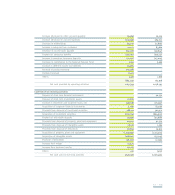
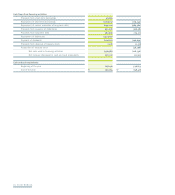
LG ELECTRONICS
Cash flows from financing activities
Proceeds from short-term borrowings
Repayment of short-term borrowings
Repayment of current maturities of long-term debt
Proceeds from issuance of debentures
Proceeds from long-term debt
Repayment of debentures
Payment of dividends
Proceeds from disposal of treasury stock
Acquisition of treasury stock
Net cash used in financing activities
Net increase (decrease) in cash and cash equivalents
Cash and cash equivalents
Beginning of the year
End of the year
40,000
(236,877)
(649,140)
602,258
482,938
(462,937)
(234,851)
2,128
-
(456,481)
(67,152)
648,416
581,264
-
(179,243)
(989,580)
906,581
275,120
-
(196,634)
11,318
(46,298)
(218,736)
111,563
536,853
648,416