LG 2005 Annual Report Download - page 55
Download and view the complete annual report
Please find page 55 of the 2005 LG annual report below. You can navigate through the pages in the report by either clicking on the pages listed below, or by using the keyword search tool below to find specific information within the annual report.-
 1
1 -
2
-
3
-
4
-
5
-
6
-
7
-
8
-
9
-
10
-
11
-
12
-
13
-
14
-
15
-
16
-
17
-
18
-
19
-
20
-
21
-
22
-
23
-
24
-
25
-
26
-
27
-
28
-
29
-
30
-
31
-
32
-
33
-
34
-
35
-
36
-
37
-
38
-
39
-
40
-
41
-
42
-
43
-
44
-
 45
45 -
 46
46 -
 47
47 -
 48
48 -
 49
49 -
 50
50 -
 51
51 -
 52
52 -
 53
53 -
 54
54 -
 55
55 -
 56
56 -
 57
57 -
 58
58 -
 59
59 -
 60
60 -
 61
61 -
 62
62 -
 63
63 -
 64
64 -
 65
65 -
66
-
67
-
68
-
69
-
70
-
71
-
72
-
73
-
74
 |
 |
52�53
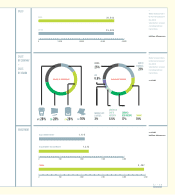
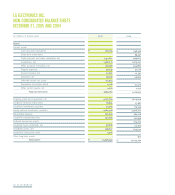
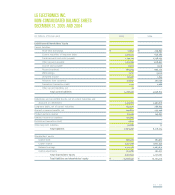
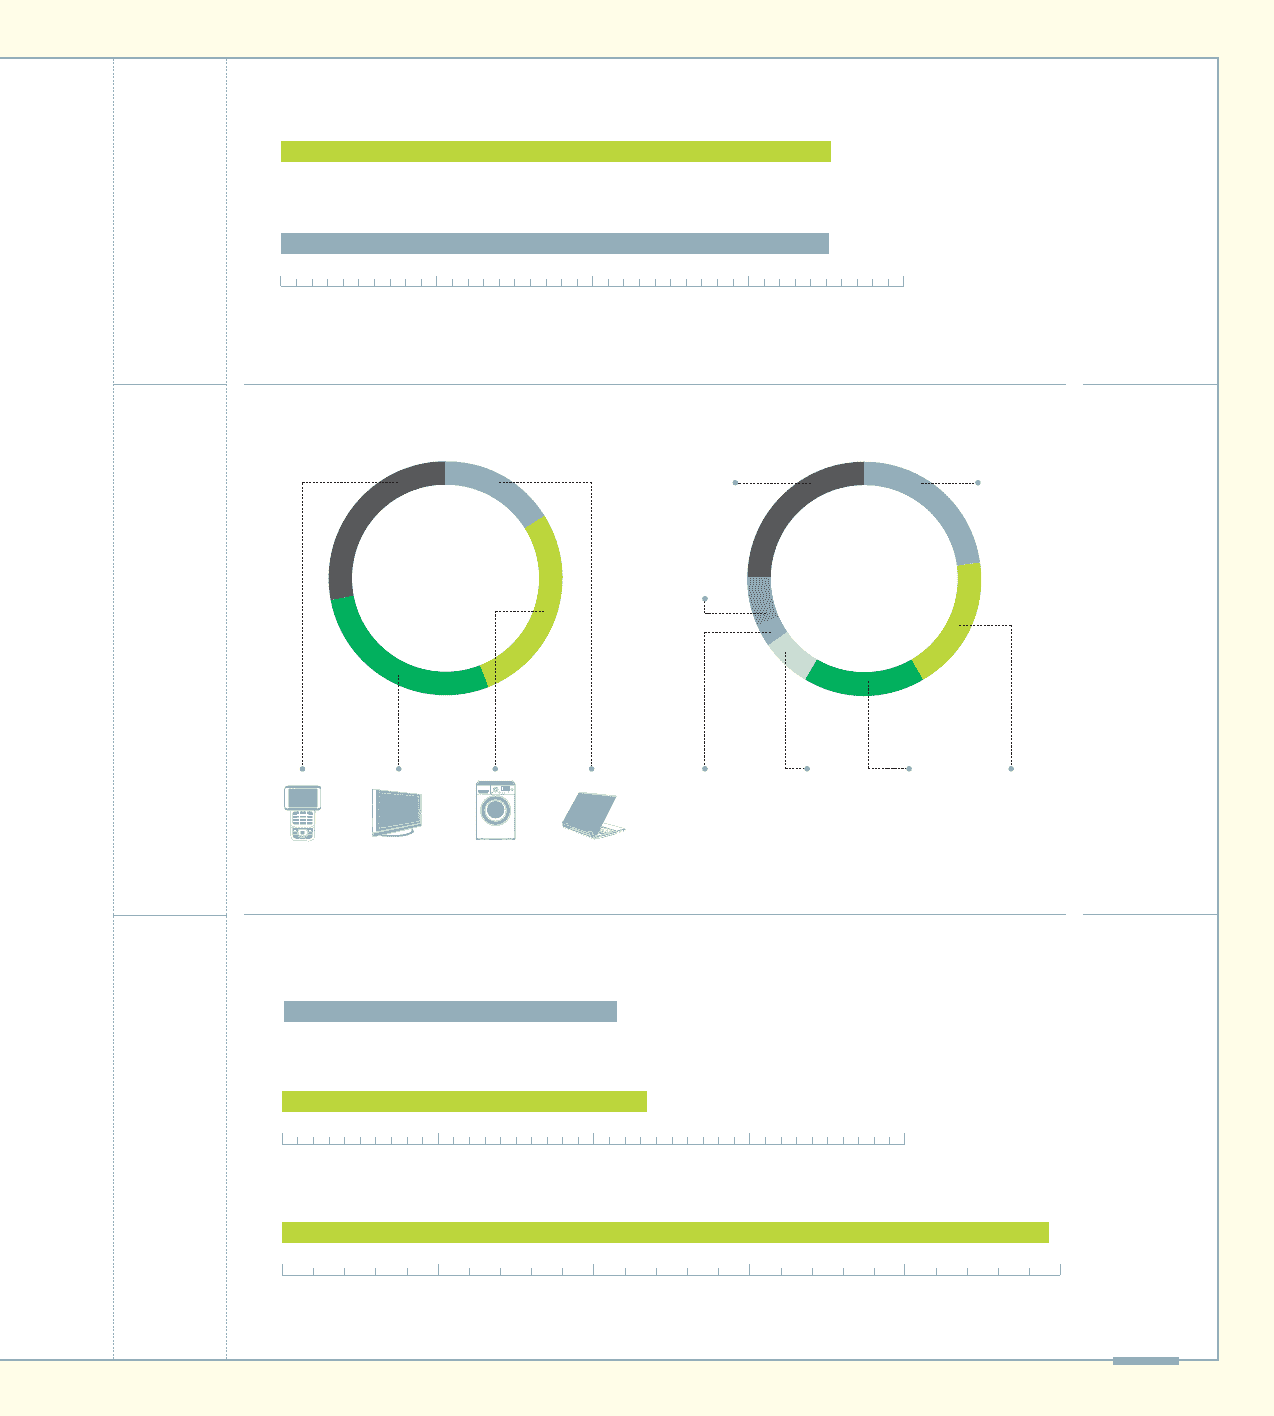
SALES
INVESTMENT
*
Global revenue refers
to the total revenue of
the global
subsidiaries’ account
excluding internal
transactions
in billions of Korean won
0 10,000 20,000 30,000 40,000
*
as of 2005
in billions of Korean won
DM 16%
MC 28% DD 28%
CHINA &
ASIA PACIFIC
17%
EUROPE
19%
KOREA
25%
NORTH
AMERICA
23%
CIS
6.5%
CENTRAL &
SOUTH
AMERICA
6.5%
MIDDLE EAST
& AFRICA
3%
SALES BY COMPANY SALES BY REGION
DA 28%
SALES
BY COMPANY
SALES
BY REGION
*
Global revenue refers
to the total revenue of
the global
subsidiaries’ account
excluding internal
transactions
as of 2005
35,563
35,289
2005
2004
0
0
500
500
1,000
1,000
1,500
1,500
2,000
2,000 2,500
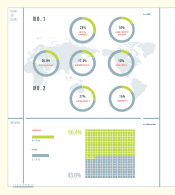
TOTAL
R&D INVESTMENT
EQUIPMENT INVESTMENT
1,125
1,322
2,447