KeyBank 2006 Annual Report Download - page 5
Download and view the complete annual report
Please find page 5 of the 2006 KeyBank annual report below. You can navigate through the pages in the report by either clicking on the pages listed below, or by using the keyword search tool below to find specific information within the annual report.-
 1
1 -
 2
2 -
 3
3 -
 4
4 -
 5
5 -
 6
6 -
 7
7 -
 8
8 -
 9
9 -
 10
10 -
 11
11 -
 12
12 -
 13
13 -
 14
14 -
 15
15 -
 16
16 -
17
-
18
-
19
-
20
-
21
-
22
-
23
-
24
-
25
-
26
-
27
-
28
-
29
-
30
-
31
-
32
-
33
-
34
-
35
-
36
-
37
-
38
-
39
-
40
-
41
-
42
-
43
-
44
-
45
-
46
-
47
-
48
-
49
-
50
-
51
-
52
-
53
-
54
-
55
-
56
-
57
-
58
-
59
-
60
-
61
-
62
-
63
-
64
-
65
-
66
-
67
-
68
-
69
-
70
-
71
-
72
-
73
-
74
-
75
-
76
-
77
-
78
-
79
-
80
-
81
-
82
-
83
-
84
-
85
-
86
-
87
-
88
-
89
-
90
-
91
-
92
-
93
-
94
-
95
-
96
-
97
-
98
-
99
-
100
-
101
-
102
-
103
-
104
-
105
-
106
 |
 |

Key 2006 53
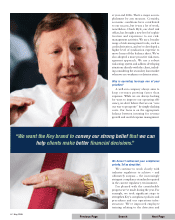
2006 PERFORMANCE
Henry, an overview on Key’s 2006 perform-
ance seems like a good place to start.
We performed well in 2006, despite
rising interest rates, an inverted yield
curve and fierce pricing competition.
Based on continuing operations, full-
year earnings per share (EPS) of $2.91
surpassed the previous year’s EPS by
11 percent. In 2006, we advanced our
strategic goal of improving our busi-
ness mix and risk profile by deciding to
divest Champion Mortgage in November
and the McDonald Investments
branch network, which closed in
February2007. We also acquired
Austin Capital Management. Austin
expands Victory Capital Management’s
portfolio of products to include hedge
funds. Further, our asset quality remained
solid during 2006.
What factors were the primarydrivers of
Key’s performance?
We had several. Average commercial
loans wereup 7 percent over 2005, while
average core deposits increased 8 percent.
Income from our fee-based businesses
rose 3 percent, driven principally by
operating leases and investment banking
income.
Could you elaborate on the strategic actions
you took to adjust Key’s business mix?
Over the last few years, we’ve worked
hard to position Key for the long haul.
The goal has been to move us up into the
higher-performing tier of banks in our
peer group. To do that, we’ve completed
15 acquisitions and divestitures (see pages
4and 5) to adjust our business mix. We
now have significantly improved our asset
quality and attained a much better risk
profile. We’ve also recruited talented
executives to lead the effort and they, in
turn, have developed teams that are
getting the job done.
How did 2006 results square with Key’s
long-term financial goals?
Our EPS goal is 8 to 10 percent growth
annually. As I said, we grew EPS 11 percent
in 2006. Return on equity (ROE)
improved to 15.43 percent in 2006, close
to our long-term goal of 16 to 18 percent.
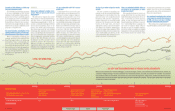
STOCK PRICE APPRECIATION
You often refer to your stock price as your
“report card.” How did Key’s stock perform
in 2006?
Our stock price was up 15 percent
for the year, and, during the fourth
quarter, Key shares reached the highest
closing price since July 1998. The total
return on Key stock, which includes the
dividend, was up 20 percent in 2006,
outperforming the 16 percent increase
in total return recorded by the S&P Banks
Index for the same period.
You did beat the S&P Banks Index last year.
How have you done longer-term?
We’ve now beaten the index three
years running. If you look back five years,
the story gets even better. Our total return
over that time is up 92 percent, com-
pared with about 64 percent for the
Banks Index and 35 percent for the broad
S&P Index (see pages 4 and 5). That
means that a shareholder who was
invested continually in Key since 2001
saw his or her investment nearly double
by the end of 2006.
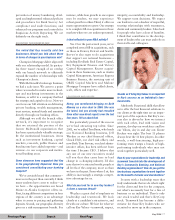
Capital ratios are an indicator of a bank’s
financial strength. How does Key fare in
this area?
Our tangible equity to total assets
capital ratio – one of a number of impor-
tant ratios tracked in our industry – is
strong. That gives us the flexibility to pay
dividends, invest in our core businesses,
take advantage of acquisition opportu-
nities and repurchase our stock. As much
as we value organic growth, we know that
taking advantage of appropriate acquisi-
tion opportunities is essential to achieving
the long-termgrowth rates we want from
our businesses.
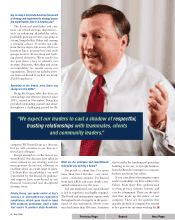
INDUSTRY OVERVIEW
Wall Street and investors generally are
watching for a turning point in the industry,
when credit quality reverses course and
begins to worsen. Do you believe that
happened in 2006?
The past two years have been two of
the best ever in terms of credit quality, for
Key and the industry.It’s clear that we’re
now at an inflection point where credit
quality industry-wide is much more
likely to worsen than improve. The
Federal Reserve Board has moved to ease
inflationary pressure through a steady
escalation in interest rates. The result to
date has been slower economic growth,
but not an economic downturn.
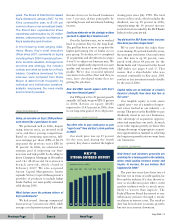
KEY’S
STRONG DIVIDEND HISTORY
dividend amounts in dollars
years. The Board of Directors increased
Key’s dividend in January 2007, for the
42nd consecutive year, to $1.46 per
common share on an annualized basis.
The Board also expanded its share
repurchase authorization by 25 million
shares, underscoring its confidence in
Key’s leadership and direction.
In the following wide-ranging Q&A,
Henry Meyer, Key’s chief executive
officer since 2001, comments on topics
including Key’s 2006 financial perform-
ance, its stock valuation, its longer-term
priorities and strategy, the industry
outlook and what he looks for in Key’s
leaders. Questions developed for this
interview were compiled from those
Meyer is asked most frequently by
individual and institutional investors,
analysts, employees, the news media
and community leaders.
Next Page
Search
Previous Page