Johnson Controls 2015 Annual Report Download - page 84
Download and view the complete annual report
Please find page 84 of the 2015 Johnson Controls annual report below. You can navigate through the pages in the report by either clicking on the pages listed below, or by using the keyword search tool below to find specific information within the annual report.-
 1
1 -
2
-
3
-
4
-
5
-
6
-
7
-
8
-
9
-
10
-
11
-
12
-
13
-
14
-
15
-
16
-
17
-
18
-
19
-
20
-
21
-
22
-
23
-
24
-
25
-
26
-
27
-
28
-
29
-
30
-
31
-
32
-
33
-
34
-
35
-
36
-
37
-
38
-
39
-
40
-
41
-
42
-
43
-
44
-
45
-
46
-
47
-
48
-
49
-
50
-
51
-
52
-
53
-
54
-
55
-
56
-
57
-
58
-
59
-
60
-
61
-
62
-
63
-
64
-
65
-
66
-
67
-
68
-
69
-
70
-
71
-
72
-
73
-
 74
74 -
 75
75 -
 76
76 -
 77
77 -
 78
78 -
 79
79 -
 80
80 -
 81
81 -
 82
82 -
 83
83 -
 84
84 -
 85
85 -
 86
86 -
 87
87 -
 88
88 -
 89
89 -
 90
90 -
 91
91 -
 92
92 -
 93
93 -
 94
94 -
95
-
96
-
97
-
98
-
99
-
100
-
101
-
102
-
103
-
104
-
105
-
106
-
107
-
108
-
109
-
110
-
111
-
112
-
113
-
114
-
115
-
116
-
117
-
118
-
119
-
120
-
121
 |
 |

84
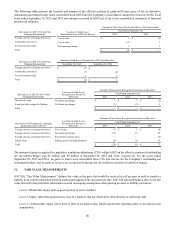
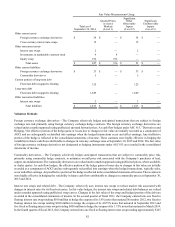
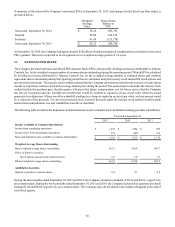
The Company uses historical data to estimate option exercises and employee terminations within the valuation model. The expected
term of options represents the period of time that options granted are expected to be outstanding. The risk-free rate for periods
during the contractual life of the option is based on the U.S. Treasury yield curve in effect at the time of grant.
Year Ended September 30,
2015 2014 2013
Expected life of option (years) 6.6 6.7 5.0 - 6.7
Risk-free interest rate 1.61% - 1.93% 1.92% 0.62% - 1.33%
Expected volatility of the Company’s stock 36.00% 36.00% 41.00%
Expected dividend yield on the Company’s stock 2.02% 2.17% 2.03%
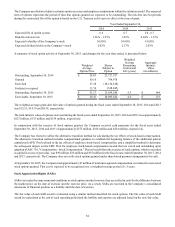
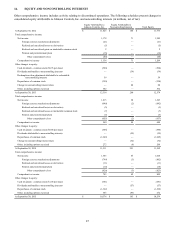
A summary of stock option activity at September 30, 2015, and changes for the year then ended, is presented below:
Weighted
Average
Option Price
Shares
Subject to
Option
Weighted
Average
Remaining
Contractual
Life (years)
Aggregate
Intrinsic
Value
(in millions)
Outstanding, September 30, 2014 $ 28.83 22,727,917
Granted 50.16 794,978
Exercised 27.28 (10,154,810)
Forfeited or expired 35.70 (328,845)
Outstanding, September 30, 2015 $ 31.17 13,039,240 5.3 $ 144
Exercisable, September 30, 2015 $ 29.41 10,095,826 4.6 $ 123
The weighted-average grant-date fair value of options granted during the fiscal years ended September 30, 2015, 2014 and 2013
was $15.51, $14.70 and $8.58, respectively.
The total intrinsic value of options exercised during the fiscal years ended September 30, 2015, 2014 and 2013 was approximately
$227 million, $135 million and $154 million, respectively.
In conjunction with the exercise of stock options granted, the Company received cash payments for the fiscal years ended
September 30, 2015, 2014 and 2013 of approximately $275 million, $186 million and $254 million, respectively.
The Company has elected to utilize the alternative transition method for calculating the tax effects of stock-based compensation.
The alternative transition method includes computational guidance to establish the beginning balance of the additional paid-in
capital pool (APIC Pool) related to the tax effects of employee stock-based compensation, and a simplified method to determine
the subsequent impact on the APIC Pool for employee stock-based compensation awards that are vested and outstanding upon
adoption of ASC 718, "Compensation - Stock Compensation." The tax benefit from the exercise of stock options, which is recorded
in capital in excess of par value, was $59 million, $34 million and $35 million for the fiscal years ended September 30, 2015, 2014
and 2013, respectively. The Company does not settle stock options granted under share-based payment arrangements for cash.
At September 30, 2015, the Company had approximately $7 million of total unrecognized compensation cost related to nonvested
stock options granted. That cost is expected to be recognized over a weighted-average period of 1.5 years.
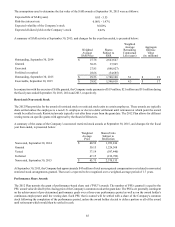
Stock Appreciation Rights (SARs)
SARs vest under the same terms and conditions as stock option awards; however, they are settled in cash for the difference between
the market price on the date of exercise and the exercise price. As a result, SARs are recorded in the Company’s consolidated
statements of financial position as a liability until the date of exercise.
The fair value of each SAR award is estimated using a similar method described for stock options. The fair value of each SAR
award is recalculated at the end of each reporting period and the liability and expense are adjusted based on the new fair value.